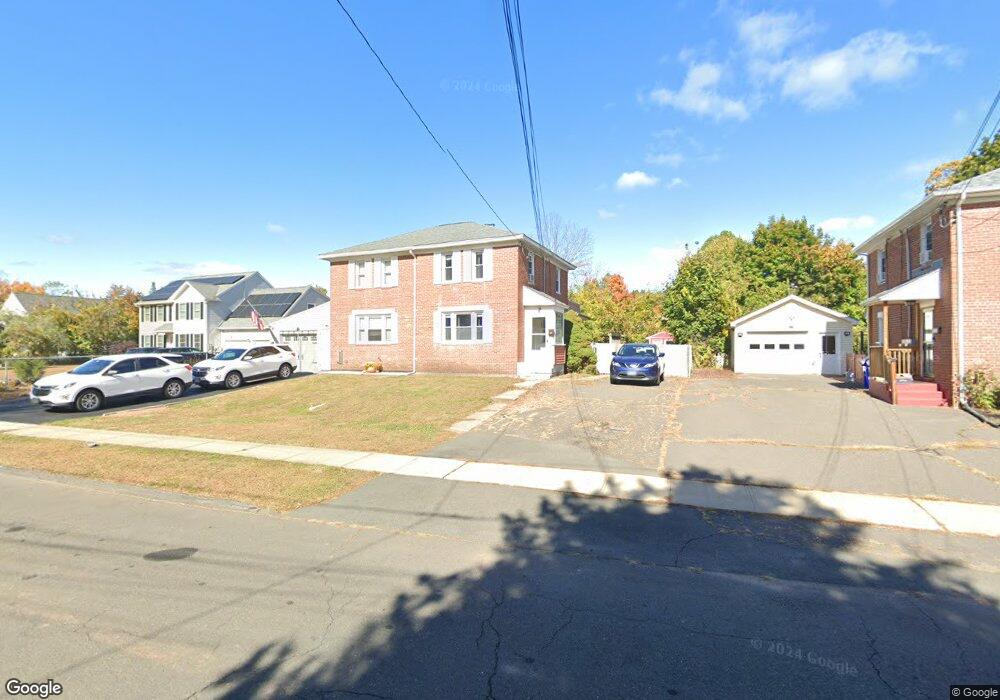
43 John St Southington, CT 06489
West Southington NeighborhoodEstimated Value: $212,000 - $290,000
2
Beds
1
Bath
960
Sq Ft
$250/Sq Ft
Est. Value
About This Home
This home is located at 43 John St, Southington, CT 06489 and is currently estimated at $240,013, approximately $250 per square foot. 43 John St is a home located in Hartford County with nearby schools including Urbin T. Kelley Elementary School, Joseph A. Depaolo Middle School, and Southington High School.
Ownership History
Date
Name
Owned For
Owner Type
Purchase Details
Closed on
Nov 30, 1992
Sold by
Lyles Richard and Lyles Maryanne
Bought by
Emery Charles and Emery Nancy
Current Estimated Value
Home Financials for this Owner
Home Financials are based on the most recent Mortgage that was taken out on this home.
Original Mortgage
$58,000
Interest Rate
7.75%
Mortgage Type
Unknown
Create a Home Valuation Report for This Property
The Home Valuation Report is an in-depth analysis detailing your home's value as well as a comparison with similar homes in the area
Home Values in the Area
Average Home Value in this Area
Purchase History
| Date | Buyer | Sale Price | Title Company |
|---|---|---|---|
| Emery Charles | $79,500 | -- |
Source: Public Records
Mortgage History
| Date | Status | Borrower | Loan Amount |
|---|---|---|---|
| Open | Emery Charles | $26,959 | |
| Closed | Emery Charles | $9,500 | |
| Closed | Emery Charles | $53,000 | |
| Closed | Emery Charles | $58,000 |
Source: Public Records
Tax History
| Year | Tax Paid | Tax Assessment Tax Assessment Total Assessment is a certain percentage of the fair market value that is determined by local assessors to be the total taxable value of land and additions on the property. | Land | Improvement |
|---|---|---|---|---|
| 2025 | $2,864 | $86,230 | $49,470 | $36,760 |
| 2024 | $2,711 | $86,230 | $49,470 | $36,760 |
| 2023 | $2,618 | $86,230 | $49,470 | $36,760 |
| 2022 | $2,512 | $86,230 | $49,470 | $36,760 |
| 2021 | $2,503 | $86,230 | $49,470 | $36,760 |
| 2020 | $2,432 | $79,400 | $50,480 | $28,920 |
| 2019 | $2,433 | $79,400 | $50,480 | $28,920 |
| 2018 | $2,420 | $79,400 | $50,480 | $28,920 |
| 2017 | $2,420 | $79,400 | $50,480 | $28,920 |
| 2016 | $2,353 | $79,400 | $50,480 | $28,920 |
| 2015 | $2,393 | $82,110 | $48,080 | $34,030 |
| 2014 | $2,329 | $82,110 | $48,080 | $34,030 |
Source: Public Records
Map
Nearby Homes
- 46 John St
- 20 John St
- 9 Preli Ct
- 28 Beecher St
- 317 West St
- 82 Summer St Unit A
- 82 Summer St Unit B
- 53 Alder Ln
- 185 West St Unit 3
- 491 Main St
- 40 Cornerstone Ct Unit 23
- 45 Hart St Unit A
- 76 Kane St
- 15 Woodruff St
- 484 Jude Ln
- 82 Grove St
- 151 Diana Rd
- 88 October Ln
- 36 Buckland St Unit 19
- 25 Whippoorwill Rd
Your Personal Tour Guide
Ask me questions while you tour the home.