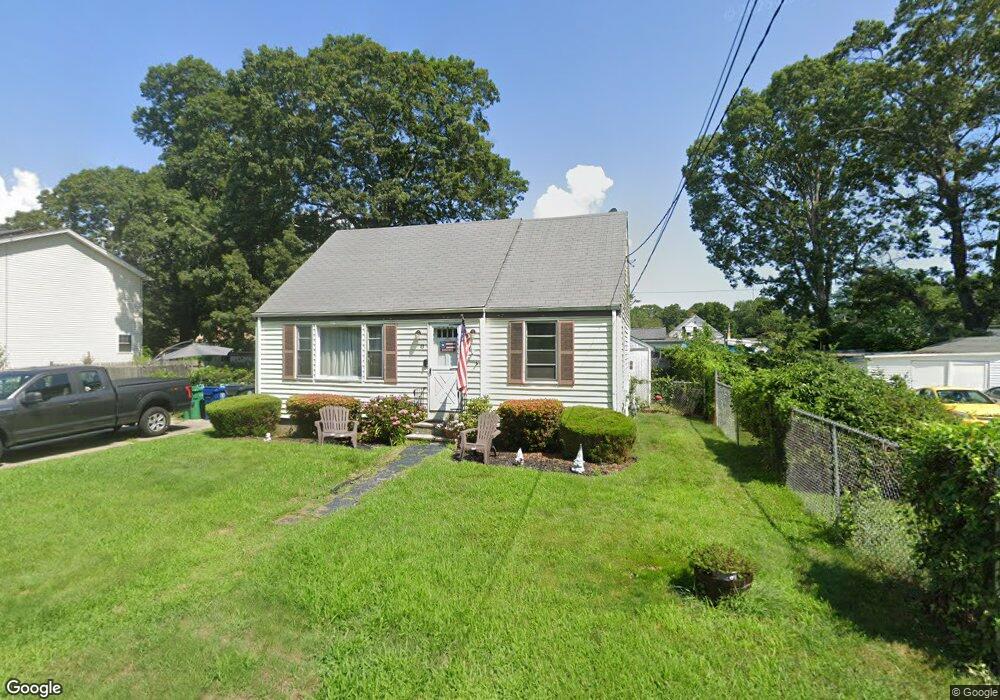
43 John St Warwick, RI 02889
Oakland Beach NeighborhoodEstimated Value: $320,000 - $376,000
3
Beds
1
Bath
1,044
Sq Ft
$335/Sq Ft
Est. Value
About This Home
This home is located at 43 John St, Warwick, RI 02889 and is currently estimated at $350,023, approximately $335 per square foot. 43 John St is a home located in Kent County with nearby schools including Saint Kevin School and Bishop Hendricken High School.
Ownership History
Date
Name
Owned For
Owner Type
Purchase Details
Closed on
Jul 26, 2019
Sold by
Beaupre Donald R
Bought by
Beaupre Donald R and Beaupre Gail
Current Estimated Value
Purchase Details
Closed on
Sep 13, 1993
Sold by
Heon Kenneth P and Heon Debra
Bought by
Beaupre Donald R and Beaupre Judith
Home Financials for this Owner
Home Financials are based on the most recent Mortgage that was taken out on this home.
Original Mortgage
$69,870
Interest Rate
7.21%
Mortgage Type
Purchase Money Mortgage
Create a Home Valuation Report for This Property
The Home Valuation Report is an in-depth analysis detailing your home's value as well as a comparison with similar homes in the area
Home Values in the Area
Average Home Value in this Area
Purchase History
| Date | Buyer | Sale Price | Title Company |
|---|---|---|---|
| Beaupre Donald R | -- | -- | |
| Beaupre Donald R | $68,500 | -- |
Source: Public Records
Mortgage History
| Date | Status | Borrower | Loan Amount |
|---|---|---|---|
| Previous Owner | Beaupre Donald R | $147,000 | |
| Previous Owner | Beaupre Donald R | $96,000 | |
| Previous Owner | Beaupre Donald R | $75,200 | |
| Previous Owner | Beaupre Donald R | $69,870 |
Source: Public Records
Tax History
| Year | Tax Paid | Tax Assessment Tax Assessment Total Assessment is a certain percentage of the fair market value that is determined by local assessors to be the total taxable value of land and additions on the property. | Land | Improvement |
|---|---|---|---|---|
| 2025 | $4,058 | $319,500 | $99,500 | $220,000 |
| 2024 | $3,311 | $228,800 | $86,600 | $142,200 |
| 2023 | $3,247 | $228,800 | $86,600 | $142,200 |
| 2022 | $2,957 | $157,900 | $50,700 | $107,200 |
| 2021 | $2,957 | $157,900 | $50,700 | $107,200 |
| 2020 | $2,957 | $157,900 | $50,700 | $107,200 |
| 2019 | $2,957 | $157,900 | $50,700 | $107,200 |
| 2018 | $2,804 | $134,800 | $50,700 | $84,100 |
| 2017 | $2,728 | $134,800 | $50,700 | $84,100 |
| 2016 | $2,728 | $134,800 | $50,700 | $84,100 |
| 2015 | $2,621 | $126,300 | $55,900 | $70,400 |
| 2014 | $2,534 | $126,300 | $55,900 | $70,400 |
| 2013 | $2,499 | $126,300 | $55,900 | $70,400 |
Source: Public Records
Map
Nearby Homes
- 31 Oakhurst Ave
- 73 Pinehurst Ave
- 75 Northup St
- 71 Pinehurst Ave
- 79 Pinehurst Ave
- 81 Pinehurst Ave
- 107 Coburn St
- 188 Wood St
- 0 Sea View Dr
- 357 Pequot Ave
- 83 Ottawa Ave
- 52 Uncas St
- 176 Canfield Ave
- 165 Canfield Ave
- 195 Oakland Beach Ave
- 90 Huron St
- 79 Suburban Pkwy
- 9 Kenneth Ave
- 201 Hollis Ave
- 585 Meadow View Ave
Your Personal Tour Guide
Ask me questions while you tour the home.