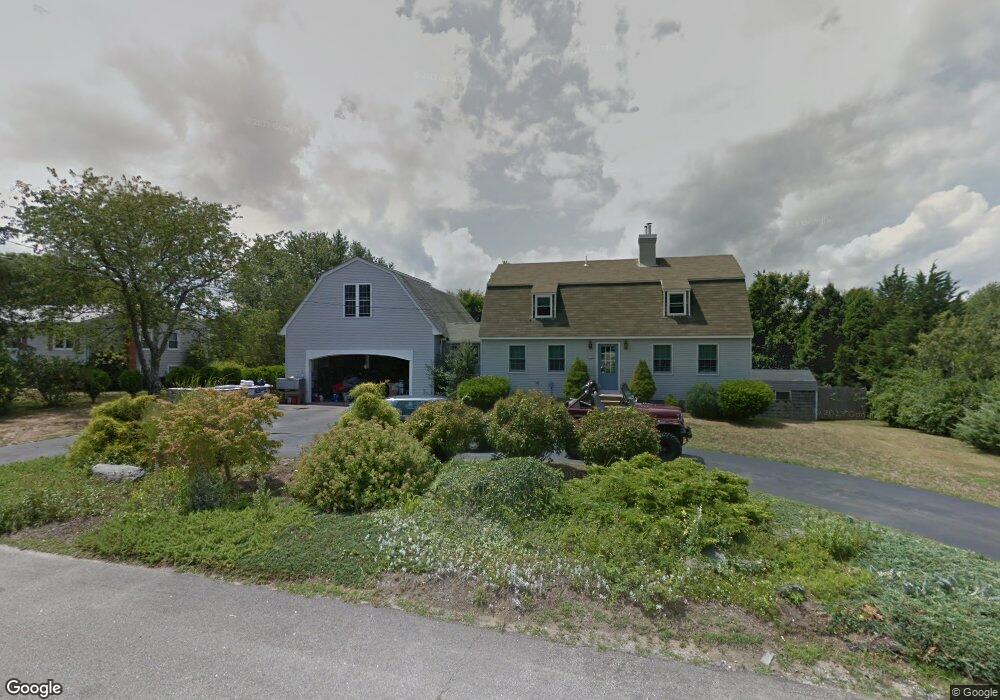
43 Keel Ave Jamestown, RI 02835
Jamestown Shores NeighborhoodEstimated Value: $857,556 - $1,023,000
3
Beds
2
Baths
1,793
Sq Ft
$505/Sq Ft
Est. Value
About This Home
This home is located at 43 Keel Ave, Jamestown, RI 02835 and is currently estimated at $904,639, approximately $504 per square foot. 43 Keel Ave is a home located in Newport County with nearby schools including Melrose Avenue School and Lawn Avenue School.
Ownership History
Date
Name
Owned For
Owner Type
Purchase Details
Closed on
Jun 25, 2014
Sold by
Lovegree Mary D and Lovegreen Steven D
Bought by
Grace Jennifer and Blanton Nichoals
Current Estimated Value
Purchase Details
Closed on
Jul 28, 2010
Sold by
Dewhirst Mark M
Bought by
Lovegreen Mary D
Purchase Details
Closed on
Aug 14, 2009
Sold by
Lovegreen Mary D
Bought by
Lovegreen Mary D and Dewhirst Mary M
Create a Home Valuation Report for This Property
The Home Valuation Report is an in-depth analysis detailing your home's value as well as a comparison with similar homes in the area
Home Values in the Area
Average Home Value in this Area
Purchase History
| Date | Buyer | Sale Price | Title Company |
|---|---|---|---|
| Grace Jennifer | -- | -- | |
| Lovegreen Steven D | -- | -- | |
| Lovegreen Mary D | $328,500 | -- | |
| Lovegreen Mary D | $328,500 | -- |
Source: Public Records
Mortgage History
| Date | Status | Borrower | Loan Amount |
|---|---|---|---|
| Previous Owner | Lovegreen Mary D | $250,000 | |
| Previous Owner | Lovegreen Mary D | $100,000 | |
| Previous Owner | Lovegreen Mary D | $140,000 |
Source: Public Records
Tax History Compared to Growth
Tax History
| Year | Tax Paid | Tax Assessment Tax Assessment Total Assessment is a certain percentage of the fair market value that is determined by local assessors to be the total taxable value of land and additions on the property. | Land | Improvement |
|---|---|---|---|---|
| 2025 | $4,215 | $747,300 | $277,300 | $470,000 |
| 2024 | $3,806 | $530,800 | $210,100 | $320,700 |
| 2023 | $3,706 | $530,900 | $210,100 | $320,800 |
| 2022 | $3,605 | $530,900 | $210,100 | $320,800 |
| 2021 | $4,148 | $501,000 | $192,800 | $308,200 |
| 2020 | $4,043 | $501,000 | $192,800 | $308,200 |
| 2019 | $4,033 | $501,000 | $192,800 | $308,200 |
| 2018 | $3,380 | $381,900 | $173,300 | $208,600 |
| 2017 | $3,307 | $381,900 | $173,300 | $208,600 |
| 2016 | $3,277 | $381,900 | $173,300 | $208,600 |
| 2015 | $3,458 | $393,900 | $202,700 | $191,200 |
| 2014 | $3,447 | $393,900 | $202,700 | $191,200 |
Source: Public Records
Map
Nearby Homes