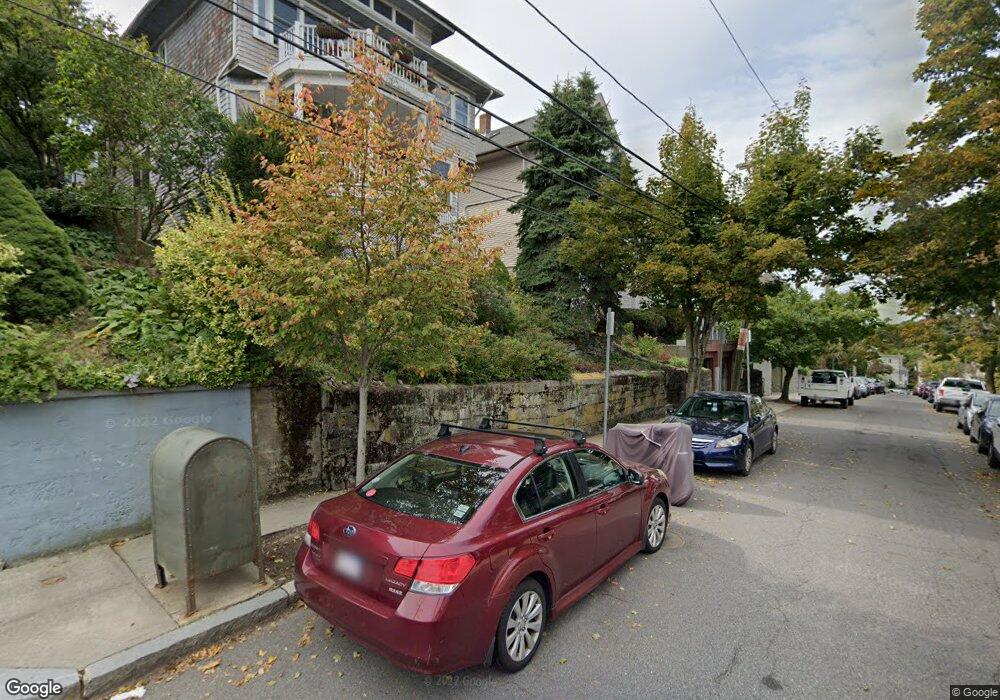
43 Langley Rd Unit 2 Brighton, MA 02135
Brighton NeighborhoodEstimated Value: $522,000 - $757,000
3
Beds
2
Baths
1,600
Sq Ft
$387/Sq Ft
Est. Value
About This Home
This home is located at 43 Langley Rd Unit 2, Brighton, MA 02135 and is currently estimated at $618,607, approximately $386 per square foot. 43 Langley Rd Unit 2 is a home located in Suffolk County with nearby schools including Shaloh House Jewish Day School, St Columbkille Partnership School, and Mesivta High School of Greater Boston.
Ownership History
Date
Name
Owned For
Owner Type
Purchase Details
Closed on
Apr 7, 2025
Sold by
Nunez Emily K
Bought by
Emily K Nunez Ft and Nunez
Current Estimated Value
Purchase Details
Closed on
Feb 24, 2023
Sold by
Nunez Jorge G and Nunez Emily K
Bought by
Nunez Emily K
Purchase Details
Closed on
Oct 23, 2006
Sold by
43 Langley Road Condo and Nunez
Bought by
Nunez Emily K and Nunez Jorge G
Create a Home Valuation Report for This Property
The Home Valuation Report is an in-depth analysis detailing your home's value as well as a comparison with similar homes in the area
Home Values in the Area
Average Home Value in this Area
Purchase History
| Date | Buyer | Sale Price | Title Company |
|---|---|---|---|
| Emily K Nunez Ft | -- | None Available | |
| Emily K Nunez Ft | -- | None Available | |
| Nunez Emily K | -- | None Available | |
| Nunez Emily K | -- | None Available | |
| Nunez Emily K | -- | -- | |
| Nunez Emily K | -- | -- |
Source: Public Records
Tax History Compared to Growth
Tax History
| Year | Tax Paid | Tax Assessment Tax Assessment Total Assessment is a certain percentage of the fair market value that is determined by local assessors to be the total taxable value of land and additions on the property. | Land | Improvement |
|---|---|---|---|---|
| 2025 | $6,007 | $518,700 | $0 | $518,700 |
| 2024 | $5,019 | $460,500 | $0 | $460,500 |
| 2023 | $4,946 | $460,500 | $0 | $460,500 |
| 2022 | $4,772 | $438,600 | $0 | $438,600 |
| 2021 | $4,161 | $390,000 | $0 | $390,000 |
| 2020 | $3,874 | $366,900 | $0 | $366,900 |
| 2019 | $3,720 | $352,900 | $0 | $352,900 |
| 2018 | $3,539 | $337,700 | $0 | $337,700 |
| 2017 | $3,311 | $312,700 | $0 | $312,700 |
| 2016 | $3,276 | $297,800 | $0 | $297,800 |
| 2015 | $3,500 | $289,000 | $0 | $289,000 |
| 2014 | $3,301 | $262,400 | $0 | $262,400 |
Source: Public Records
Map
Nearby Homes
- 18 Breck Ave Unit 18
- 34 Larch St Unit 34
- 32 Larch St Unit 34
- 32-34 Larch St
- 365 Faneuil St Unit 2
- 427-435 Faneuil St Unit R4
- 12 Mina Way
- 10 Mina Way
- 22 Bigelow St
- 142 Kenrick St Unit 36
- 39 Champney St
- 21 Glenley Terrace
- 8 Tremont Place
- 21 Upcrest Rd
- 116 Lake Shore Rd Unit 4
- 14 Atkins St
- 461 Washington St Unit 301
- 108 Lake Shore Rd Unit 4
- 21 Glenmont Rd
- 99 Tremont St Unit 105
- 43 Langley Rd Unit 1
- 43 Langley Rd
- 39 Langley Rd
- 39 Langley Rd Unit 100
- 39 Langley Rd Unit 1
- 39 Langley Rd Unit 1D
- 47 Langley Rd
- 35 Langley Rd
- 35 Langley Rd Unit 2
- 35 Langley Rd Unit 1
- 51 Langley Rd Unit 53
- 51 Langley Rd Unit 51
- 51 Langley Rd Unit 1
- 51 Langley Rd
- 44 North Crescent Circuit
- 48 Langley Rd Unit 50
- 50 Langley Rd Unit 50
- 48-50 Langley Rd
- 50 Langley Rd Unit 1
- 48 Langley Rd