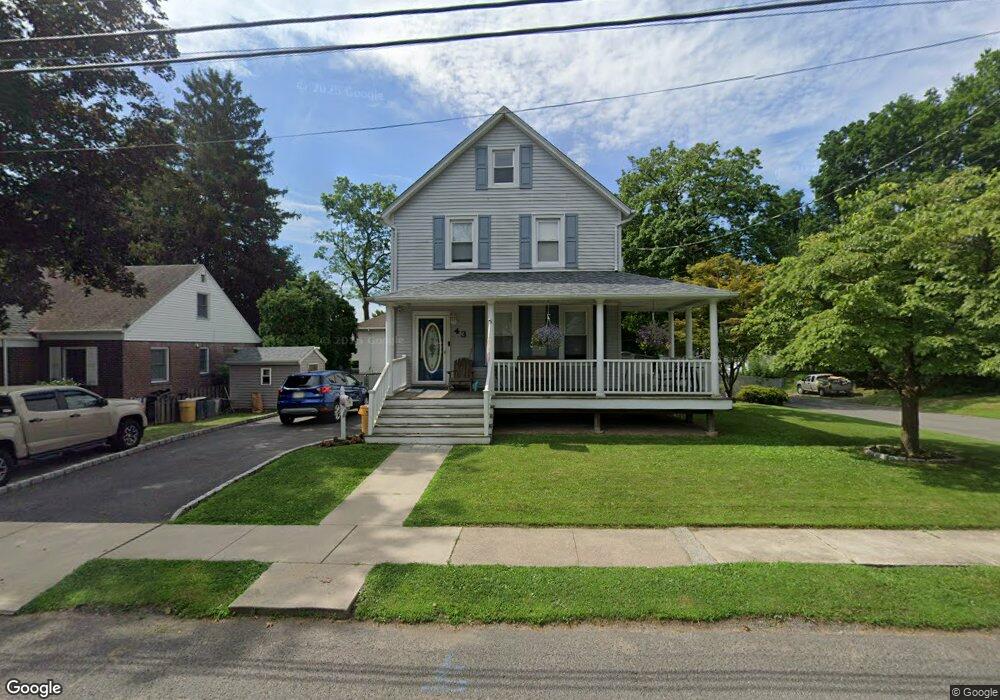
43 Larch Ave Dumont, NJ 07628
Estimated Value: $655,000 - $789,843
--
Bed
--
Bath
1,451
Sq Ft
$490/Sq Ft
Est. Value
About This Home
This home is located at 43 Larch Ave, Dumont, NJ 07628 and is currently estimated at $711,461, approximately $490 per square foot. 43 Larch Ave is a home located in Bergen County with nearby schools including Dumont High School.
Ownership History
Date
Name
Owned For
Owner Type
Purchase Details
Closed on
Jul 21, 1999
Sold by
Cosney Susan
Bought by
Grob David and Grob Danielle
Current Estimated Value
Home Financials for this Owner
Home Financials are based on the most recent Mortgage that was taken out on this home.
Original Mortgage
$122,700
Outstanding Balance
$34,179
Interest Rate
7.49%
Mortgage Type
FHA
Estimated Equity
$677,282
Purchase Details
Closed on
May 1, 1998
Sold by
15 Wakelee Drive Corp
Bought by
15 Wakelee Drive Corp and Cosney Susan
Purchase Details
Closed on
Mar 4, 1998
Sold by
Cosney Dan C
Bought by
Cosney Susan
Create a Home Valuation Report for This Property
The Home Valuation Report is an in-depth analysis detailing your home's value as well as a comparison with similar homes in the area
Home Values in the Area
Average Home Value in this Area
Purchase History
| Date | Buyer | Sale Price | Title Company |
|---|---|---|---|
| Grob David | $150,000 | -- | |
| 15 Wakelee Drive Corp | -- | -- | |
| Cosney Susan | $24,000 | -- |
Source: Public Records
Mortgage History
| Date | Status | Borrower | Loan Amount |
|---|---|---|---|
| Open | Grob David | $122,700 |
Source: Public Records
Tax History Compared to Growth
Tax History
| Year | Tax Paid | Tax Assessment Tax Assessment Total Assessment is a certain percentage of the fair market value that is determined by local assessors to be the total taxable value of land and additions on the property. | Land | Improvement |
|---|---|---|---|---|
| 2025 | $11,906 | $507,800 | $315,000 | $192,800 |
| 2024 | $11,613 | $292,900 | $185,000 | $107,900 |
| 2023 | $11,373 | $292,900 | $185,000 | $107,900 |
| 2022 | $11,373 | $292,900 | $185,000 | $107,900 |
| 2021 | $11,318 | $292,900 | $185,000 | $107,900 |
| 2020 | $11,010 | $292,900 | $185,000 | $107,900 |
| 2019 | $10,747 | $292,900 | $185,000 | $107,900 |
| 2018 | $10,527 | $292,900 | $185,000 | $107,900 |
| 2017 | $10,325 | $292,900 | $185,000 | $107,900 |
| 2016 | $10,085 | $292,900 | $185,000 | $107,900 |
| 2015 | $9,853 | $292,900 | $185,000 | $107,900 |
| 2014 | $9,660 | $292,900 | $185,000 | $107,900 |
Source: Public Records
Map
Nearby Homes