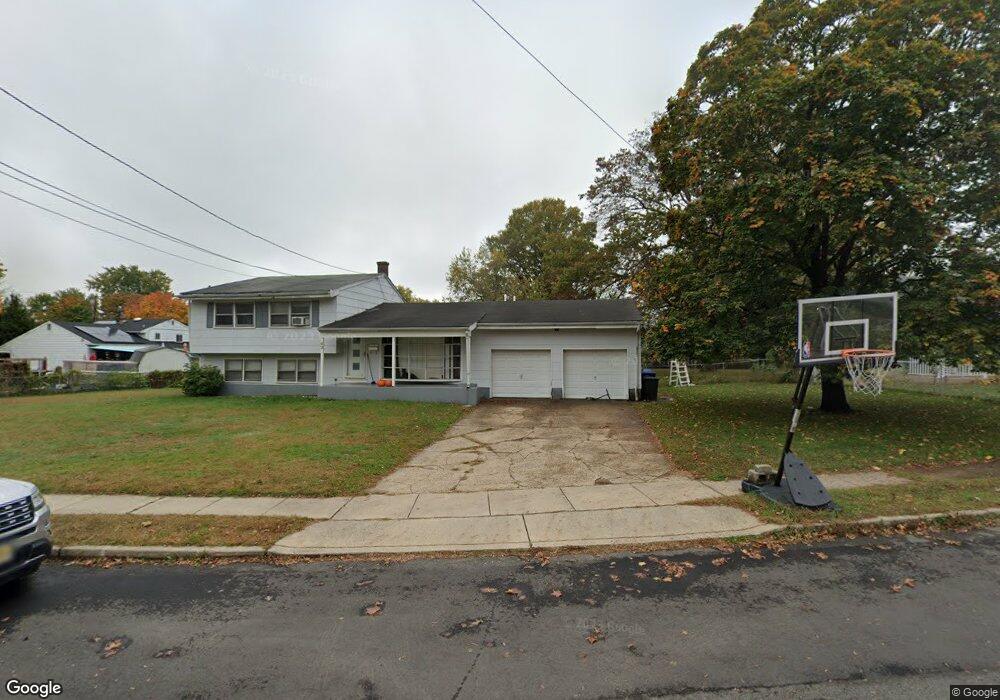
43 Latimer Way Burlington, NJ 08016
Estimated Value: $348,000 - $444,000
--
Bed
--
Bath
1,708
Sq Ft
$238/Sq Ft
Est. Value
About This Home
This home is located at 43 Latimer Way, Burlington, NJ 08016 and is currently estimated at $406,540, approximately $238 per square foot. 43 Latimer Way is a home located in Burlington County with nearby schools including B Bernice Young Elementary School, Fountain Woods Elementary School, and Burlington Township Middle School at Springside.
Ownership History
Date
Name
Owned For
Owner Type
Purchase Details
Closed on
Apr 16, 2021
Sold by
Barclay Laurence G and Barclay Ashlee
Bought by
Barclay Laurence G
Current Estimated Value
Purchase Details
Closed on
Apr 23, 2003
Sold by
Hawkins Carole Y
Bought by
Barclay Dorene
Home Financials for this Owner
Home Financials are based on the most recent Mortgage that was taken out on this home.
Original Mortgage
$160,471
Interest Rate
5.64%
Mortgage Type
FHA
Create a Home Valuation Report for This Property
The Home Valuation Report is an in-depth analysis detailing your home's value as well as a comparison with similar homes in the area
Home Values in the Area
Average Home Value in this Area
Purchase History
| Date | Buyer | Sale Price | Title Company |
|---|---|---|---|
| Barclay Laurence G | -- | Delaware Valley Abstract Cor | |
| Barclay Lawrence G | -- | New Title Company Name | |
| Barclay Lawrence G | -- | Delaware Valley Abstract Cor | |
| Barclay Dorene | $163,000 | Commonwealth Land Title Ins |
Source: Public Records
Mortgage History
| Date | Status | Borrower | Loan Amount |
|---|---|---|---|
| Previous Owner | Barclay Dorene | $160,471 |
Source: Public Records
Tax History Compared to Growth
Tax History
| Year | Tax Paid | Tax Assessment Tax Assessment Total Assessment is a certain percentage of the fair market value that is determined by local assessors to be the total taxable value of land and additions on the property. | Land | Improvement |
|---|---|---|---|---|
| 2025 | $5,273 | $173,900 | $45,100 | $128,800 |
| 2024 | $5,194 | $173,900 | $45,100 | $128,800 |
| 2023 | $5,194 | $173,900 | $45,100 | $128,800 |
| 2022 | $5,172 | $173,900 | $45,100 | $128,800 |
| 2021 | $5,224 | $173,900 | $45,100 | $128,800 |
| 2020 | $5,212 | $173,900 | $45,100 | $128,800 |
| 2019 | $5,224 | $173,900 | $45,100 | $128,800 |
| 2018 | $5,146 | $173,900 | $45,100 | $128,800 |
| 2017 | $5,114 | $173,900 | $45,100 | $128,800 |
| 2016 | $5,736 | $191,200 | $48,600 | $142,600 |
| 2015 | $5,637 | $191,200 | $48,600 | $142,600 |
| 2014 | $5,430 | $191,200 | $48,600 | $142,600 |
Source: Public Records
Map
Nearby Homes