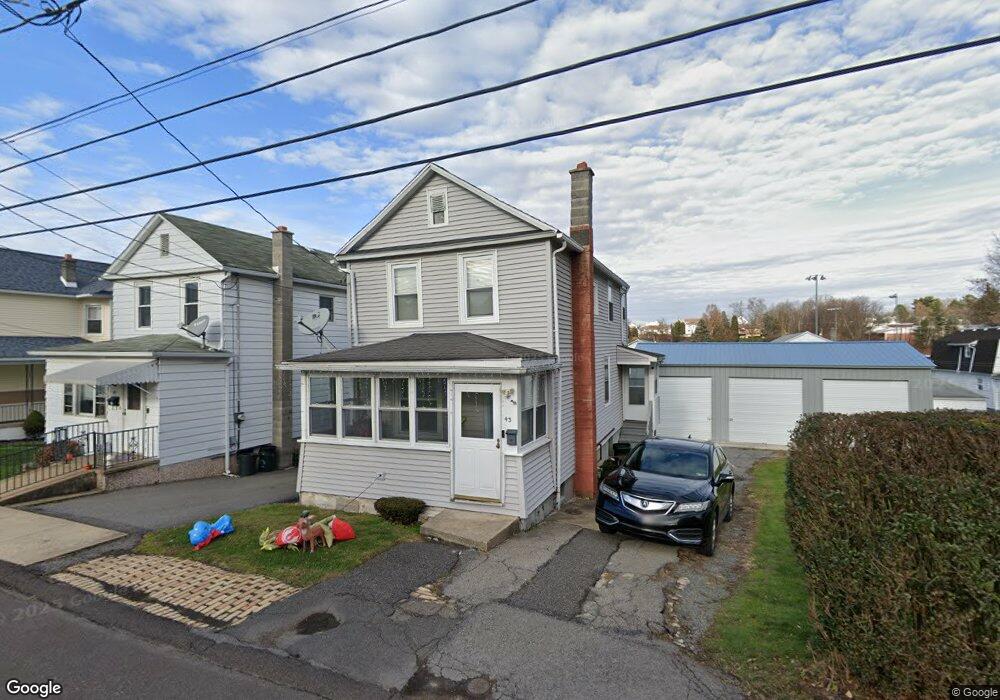
43 Laurel St Plains, PA 18705
Estimated Value: $153,000 - $162,090
2
Beds
1
Bath
1,344
Sq Ft
$117/Sq Ft
Est. Value
About This Home
This home is located at 43 Laurel St, Plains, PA 18705 and is currently estimated at $157,773, approximately $117 per square foot. 43 Laurel St is a home located in Luzerne County with nearby schools including Leo E. Solomon-Plains Elementary School, Solomon/Plains Junior High School, and Al Noor Islamic Academy.
Ownership History
Date
Name
Owned For
Owner Type
Purchase Details
Closed on
Jul 25, 2012
Sold by
Wells Fargo Bank Na
Bought by
Dabbieri Nicholas
Current Estimated Value
Home Financials for this Owner
Home Financials are based on the most recent Mortgage that was taken out on this home.
Original Mortgage
$34,400
Outstanding Balance
$5,527
Interest Rate
3.7%
Mortgage Type
Seller Take Back
Estimated Equity
$152,246
Purchase Details
Closed on
Mar 13, 2012
Sold by
Oboyle James J and Oboyle Kathleen M
Bought by
Wells Fargo Bank Na
Create a Home Valuation Report for This Property
The Home Valuation Report is an in-depth analysis detailing your home's value as well as a comparison with similar homes in the area
Home Values in the Area
Average Home Value in this Area
Purchase History
| Date | Buyer | Sale Price | Title Company |
|---|---|---|---|
| Dabbieri Nicholas | $43,000 | None Available | |
| Wells Fargo Bank Na | $4,626 | None Available |
Source: Public Records
Mortgage History
| Date | Status | Borrower | Loan Amount |
|---|---|---|---|
| Open | Dabbieri Nicholas | $34,400 |
Source: Public Records
Tax History Compared to Growth
Tax History
| Year | Tax Paid | Tax Assessment Tax Assessment Total Assessment is a certain percentage of the fair market value that is determined by local assessors to be the total taxable value of land and additions on the property. | Land | Improvement |
|---|---|---|---|---|
| 2025 | $1,769 | $66,100 | $19,300 | $46,800 |
| 2024 | $1,769 | $66,100 | $19,300 | $46,800 |
| 2023 | $1,769 | $66,100 | $19,300 | $46,800 |
| 2022 | $1,756 | $66,100 | $19,300 | $46,800 |
| 2021 | $1,483 | $55,800 | $19,300 | $36,500 |
| 2020 | $1,483 | $55,800 | $19,300 | $36,500 |
| 2019 | $1,439 | $55,800 | $19,300 | $36,500 |
| 2018 | $1,406 | $55,800 | $19,300 | $36,500 |
| 2017 | $1,373 | $55,800 | $19,300 | $36,500 |
| 2016 | -- | $55,800 | $19,300 | $36,500 |
| 2015 | -- | $55,800 | $19,300 | $36,500 |
| 2014 | -- | $55,800 | $19,300 | $36,500 |
Source: Public Records
Map
Nearby Homes