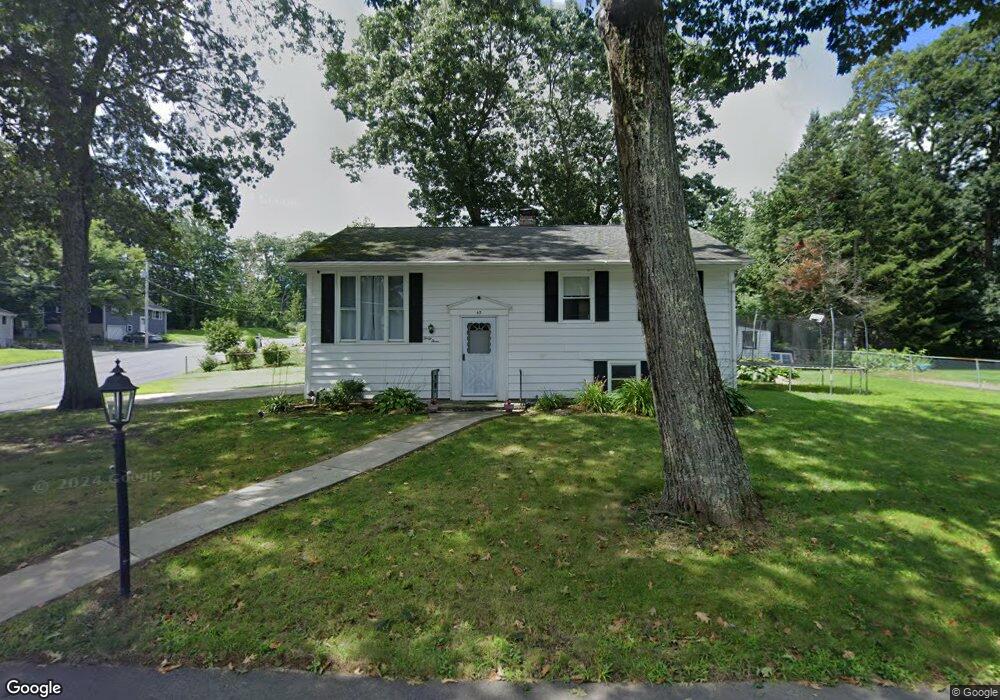
43 Libby Ave Marlborough, MA 01752
Estimated Value: $460,451 - $608,000
3
Beds
1
Bath
999
Sq Ft
$550/Sq Ft
Est. Value
About This Home
This home is located at 43 Libby Ave, Marlborough, MA 01752 and is currently estimated at $549,863, approximately $550 per square foot. 43 Libby Ave is a home located in Middlesex County with nearby schools including Marlborough High School, New Covenant Christian School, and Glenhaven Academy - JRI School.
Ownership History
Date
Name
Owned For
Owner Type
Purchase Details
Closed on
Sep 25, 1996
Sold by
May Barbara C
Bought by
Araujo Marcos L and Araujo Silvanete
Current Estimated Value
Home Financials for this Owner
Home Financials are based on the most recent Mortgage that was taken out on this home.
Original Mortgage
$96,000
Outstanding Balance
$8,611
Interest Rate
7.83%
Mortgage Type
Purchase Money Mortgage
Estimated Equity
$541,252
Create a Home Valuation Report for This Property
The Home Valuation Report is an in-depth analysis detailing your home's value as well as a comparison with similar homes in the area
Home Values in the Area
Average Home Value in this Area
Purchase History
| Date | Buyer | Sale Price | Title Company |
|---|---|---|---|
| Araujo Marcos L | $120,000 | -- |
Source: Public Records
Mortgage History
| Date | Status | Borrower | Loan Amount |
|---|---|---|---|
| Open | Araujo Marcos L | $96,000 | |
| Previous Owner | Araujo Marcos L | $35,000 | |
| Previous Owner | Araujo Marcos L | $20,000 |
Source: Public Records
Tax History
| Year | Tax Paid | Tax Assessment Tax Assessment Total Assessment is a certain percentage of the fair market value that is determined by local assessors to be the total taxable value of land and additions on the property. | Land | Improvement |
|---|---|---|---|---|
| 2025 | $4,398 | $446,000 | $232,600 | $213,400 |
| 2024 | $4,280 | $418,000 | $211,400 | $206,600 |
| 2023 | $4,466 | $387,000 | $170,500 | $216,500 |
| 2022 | $4,383 | $334,100 | $162,400 | $171,700 |
| 2021 | $8,747 | $309,700 | $135,300 | $174,400 |
| 2020 | $4,190 | $295,500 | $128,900 | $166,600 |
| 2019 | $4,072 | $289,400 | $126,300 | $163,100 |
| 2018 | $4,066 | $275,100 | $101,900 | $173,200 |
| 2017 | $3,867 | $252,400 | $100,700 | $151,700 |
| 2016 | $3,721 | $242,600 | $100,700 | $141,900 |
| 2015 | $3,581 | $227,200 | $108,300 | $118,900 |
Source: Public Records
Map
Nearby Homes
- 40 Sheridan Rd
- 616 Boston Post Rd E Unit 9
- 24 Wilson St Unit 4
- 688 Boston Post Rd E Unit 304
- 688 Boston Post Rd E Unit 103
- 50 Mustang Ave
- 70 Victoria Ln
- 244 Robert Rd
- 32 Ethel
- 181 Boston Post Rd E Unit 26
- 181 Boston Post Rd E Unit 64
- 79 Royce Rd
- 28 Ruth Dr
- 53 Wagon Hill Rd
- 849 Boston Post Rd E Unit 9F
- 620 Farm Rd
- 20 Virginia Ave
- 70 Phelps St
- 11 Sonia Dr
- 48 Cook Ln
Your Personal Tour Guide
Ask me questions while you tour the home.