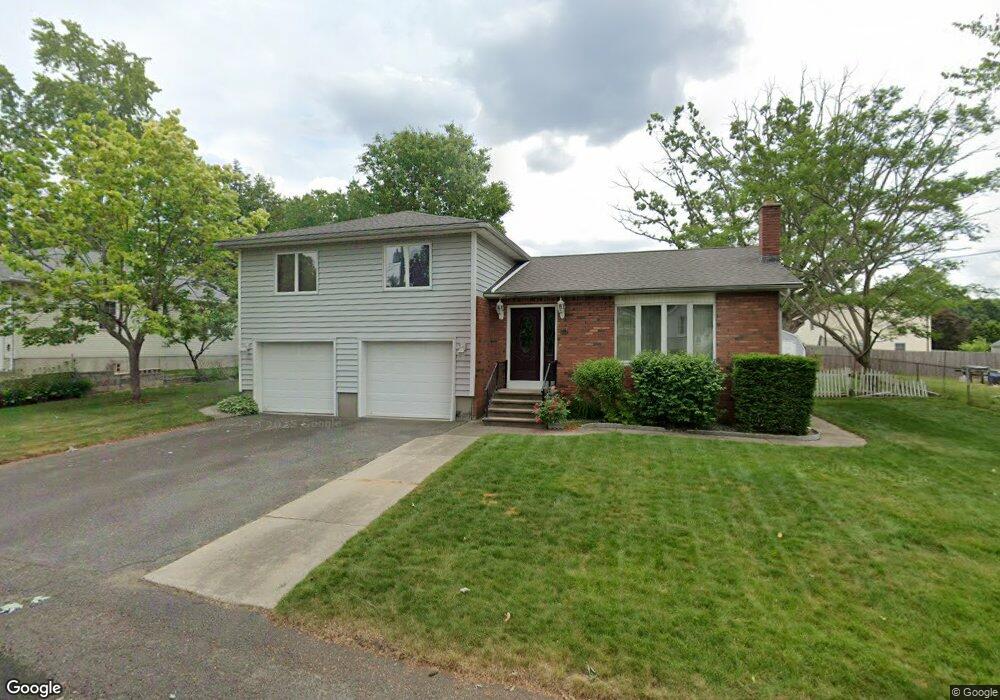
43 Lillian St Ludlow, MA 01056
Estimated Value: $375,040 - $453,000
4
Beds
2
Baths
2,100
Sq Ft
$192/Sq Ft
Est. Value
About This Home
This home is located at 43 Lillian St, Ludlow, MA 01056 and is currently estimated at $403,760, approximately $192 per square foot. 43 Lillian St is a home located in Hampden County with nearby schools including East Street Elementary School, Chapin Street Elementary School, and Paul R. Baird Middle School.
Ownership History
Date
Name
Owned For
Owner Type
Purchase Details
Closed on
Sep 30, 2009
Sold by
Torres Jose A and Torres Lucinda
Bought by
Saraiva Nelson
Current Estimated Value
Create a Home Valuation Report for This Property
The Home Valuation Report is an in-depth analysis detailing your home's value as well as a comparison with similar homes in the area
Home Values in the Area
Average Home Value in this Area
Purchase History
| Date | Buyer | Sale Price | Title Company |
|---|---|---|---|
| Saraiva Nelson | $258,000 | -- | |
| Saraiva Nelson | $258,000 | -- |
Source: Public Records
Mortgage History
| Date | Status | Borrower | Loan Amount |
|---|---|---|---|
| Previous Owner | Saraiva Nelson | $16,636 | |
| Previous Owner | Saraiva Nelson | $114,000 |
Source: Public Records
Tax History Compared to Growth
Tax History
| Year | Tax Paid | Tax Assessment Tax Assessment Total Assessment is a certain percentage of the fair market value that is determined by local assessors to be the total taxable value of land and additions on the property. | Land | Improvement |
|---|---|---|---|---|
| 2025 | $5,828 | $335,900 | $69,800 | $266,100 |
| 2024 | $5,651 | $312,400 | $69,800 | $242,600 |
| 2023 | $5,309 | $272,100 | $58,000 | $214,100 |
| 2022 | $5,027 | $251,500 | $58,000 | $193,500 |
| 2021 | $4,990 | $236,700 | $58,000 | $178,700 |
| 2020 | $4,821 | $233,800 | $57,200 | $176,600 |
| 2019 | $4,501 | $227,100 | $56,600 | $170,500 |
| 2018 | $4,232 | $222,600 | $56,600 | $166,000 |
| 2017 | $4,116 | $222,100 | $57,600 | $164,500 |
| 2016 | $3,990 | $220,100 | $59,800 | $160,300 |
| 2015 | $3,740 | $216,300 | $59,200 | $157,100 |
Source: Public Records
Map
Nearby Homes
- 166-168 Main St
- 201 Main St
- 298 Main St
- 1200 Worcester St
- 295 Main St
- 33 Grimard St
- 96 Lyons St
- 189 Essex St Unit H
- 20 Connolly St
- 34-36 Mazarin St
- 58 Mariana Ln
- 42 Roy St
- 0 Fuller St Unit 73409741
- 105 Mazarin St
- 25 Burke St
- 70 Fuller St
- 3 Fontaine St
- 84 Fuller St Unit 1
- 61 Massachusetts Ave
- 0 Parker St (Ws) Unit 73388310