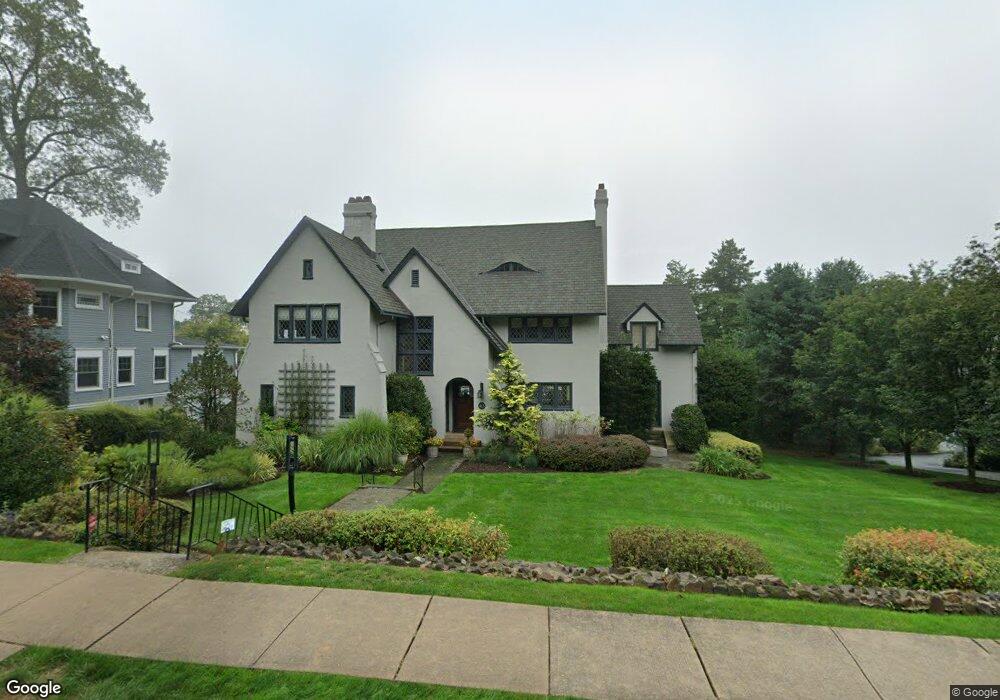
43 Lloyd Rd Montclair, NJ 07042
Estimated Value: $2,141,765 - $2,519,000
Studio
--
Bath
4,877
Sq Ft
$483/Sq Ft
Est. Value
About This Home
This home is located at 43 Lloyd Rd, Montclair, NJ 07042 and is currently estimated at $2,356,441, approximately $483 per square foot. 43 Lloyd Rd is a home located in Essex County with nearby schools including Hillside School, Nishuane School, and Bradford School.
Ownership History
Date
Name
Owned For
Owner Type
Purchase Details
Closed on
Dec 5, 2002
Sold by
Eldakkak Selim M
Bought by
Obrien James
Current Estimated Value
Purchase Details
Closed on
Dec 2, 1997
Sold by
Peterson Charles
Bought by
Dakkah Selim El and Dakkah Norma El
Home Financials for this Owner
Home Financials are based on the most recent Mortgage that was taken out on this home.
Original Mortgage
$200,000
Interest Rate
7.08%
Purchase Details
Closed on
Mar 29, 1995
Sold by
Oki Sharon
Bought by
Peterson Charles and Peterson Susan
Home Financials for this Owner
Home Financials are based on the most recent Mortgage that was taken out on this home.
Original Mortgage
$508,000
Interest Rate
8.8%
Create a Home Valuation Report for This Property
The Home Valuation Report is an in-depth analysis detailing your home's value as well as a comparison with similar homes in the area
Home Values in the Area
Average Home Value in this Area
Purchase History
| Date | Buyer | Sale Price | Title Company |
|---|---|---|---|
| Obrien James | $1,185,000 | -- | |
| -- | $1,165,000 | -- | |
| Dakkah Selim El | $650,000 | -- | |
| Peterson Charles | $635,000 | -- |
Source: Public Records
Mortgage History
| Date | Status | Borrower | Loan Amount |
|---|---|---|---|
| Previous Owner | Dakkah Selim El | $200,000 | |
| Previous Owner | Peterson Charles | $508,000 |
Source: Public Records
Tax History
| Year | Tax Paid | Tax Assessment Tax Assessment Total Assessment is a certain percentage of the fair market value that is determined by local assessors to be the total taxable value of land and additions on the property. | Land | Improvement |
|---|---|---|---|---|
| 2025 | $43,878 | $1,289,400 | $356,000 | $933,400 |
| 2024 | $43,582 | $1,289,400 | $356,000 | $933,400 |
| 2022 | $42,395 | $1,289,400 | $356,000 | $933,400 |
| 2021 | $41,661 | $1,289,400 | $356,000 | $933,400 |
| 2020 | $40,990 | $1,289,400 | $356,000 | $933,400 |
| 2019 | $40,565 | $1,289,400 | $356,000 | $933,400 |
| 2018 | $39,894 | $1,289,400 | $356,000 | $933,400 |
| 2017 | $41,948 | $1,123,400 | $349,900 | $773,500 |
| 2016 | $40,824 | $1,123,400 | $349,900 | $773,500 |
| 2015 | $39,611 | $1,123,400 | $349,900 | $773,500 |
| 2014 | $38,285 | $1,123,400 | $349,900 | $773,500 |
Source: Public Records
Map
Nearby Homes
- 8 Highmont Terrace
- 51 Afterglow Ave
- 26 Orange Rd
- 361 Claremont Ave Unit 11
- 29 Upper Mountain Ave Unit C2901
- 112 Valley Rd Unit A
- 112 Valley Rd Unit B
- 94 Church St
- 12 Ravine Rd
- 10 Robert Ct
- 415 Claremont Ave Unit 4A
- 86 Sunset Ave
- 262 Claremont Ave
- 10 Crestmont Rd Unit 6C
- 10 Crestmont Rd Unit 1A
- 97 Mount Prospect Ave
- 23 Otis Place
- 19 William St
- 6 William St
- 180 Union St
- 43 Lloyd Rd Unit 2
- 39 Lloyd Rd
- 45 Lloyd Rd
- 35 Lloyd Rd
- 49 Lloyd Rd
- 33 Lloyd Rd
- 40 Lloyd Rd
- 10 Crestview Ct
- 53 Lloyd Rd
- 50 Lloyd Rd
- 50 Lloyd Rd Unit Carriage H
- 50 Lloyd Rd Unit 3
- 31 Lloyd Rd
- 14 Walden Place
- 21 Hoburg Place
- 57 Lloyd Rd
- 52 Lloyd Rd
- 4 Crestview Ct
- 12 S Mountain Terrace Unit 33
- 12 S Mountain Terrace Unit 30
Your Personal Tour Guide
Ask me questions while you tour the home.