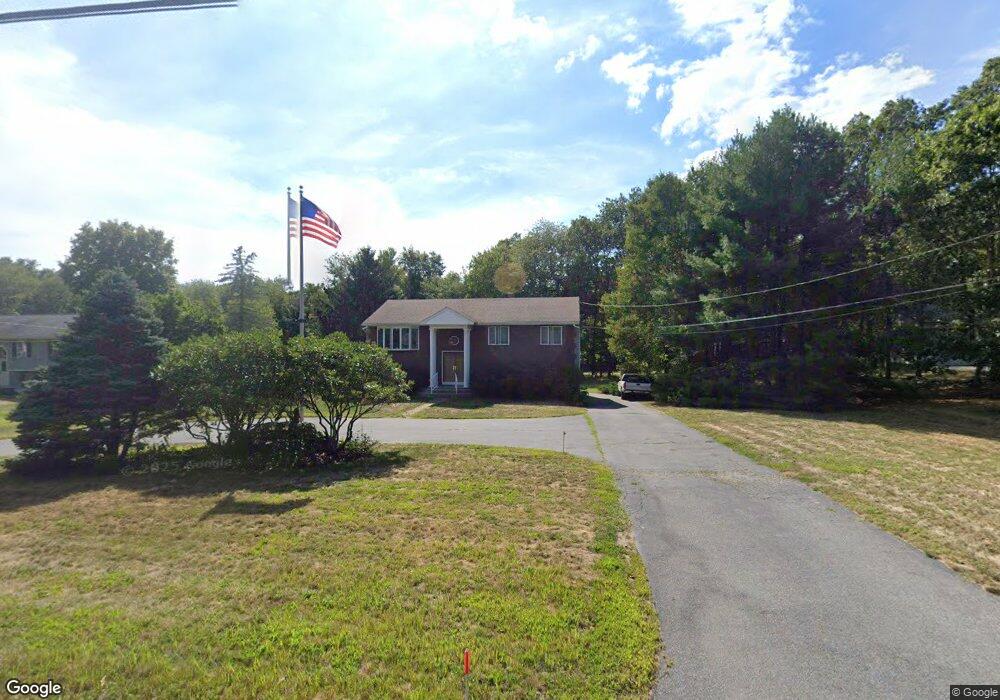
43 Locust St Berkley, MA 02779
Berkley Bridge/Lower Berkley NeighborhoodEstimated Value: $548,230 - $609,000
3
Beds
2
Baths
1,344
Sq Ft
$420/Sq Ft
Est. Value
About This Home
This home is located at 43 Locust St, Berkley, MA 02779 and is currently estimated at $564,058, approximately $419 per square foot. 43 Locust St is a home located in Bristol County with nearby schools including Berkley Community School and Our Lady of Lourdes School.
Ownership History
Date
Name
Owned For
Owner Type
Purchase Details
Closed on
Sep 28, 1988
Sold by
Silveira Henrique M
Bought by
Habelt Stephen J
Current Estimated Value
Home Financials for this Owner
Home Financials are based on the most recent Mortgage that was taken out on this home.
Original Mortgage
$133,000
Interest Rate
10.66%
Mortgage Type
Purchase Money Mortgage
Create a Home Valuation Report for This Property
The Home Valuation Report is an in-depth analysis detailing your home's value as well as a comparison with similar homes in the area
Home Values in the Area
Average Home Value in this Area
Purchase History
| Date | Buyer | Sale Price | Title Company |
|---|---|---|---|
| Habelt Stephen J | $193,000 | -- |
Source: Public Records
Mortgage History
| Date | Status | Borrower | Loan Amount |
|---|---|---|---|
| Open | Habelt Stephen J | $132,000 | |
| Closed | Habelt Stephen J | $20,000 | |
| Closed | Habelt Stephen J | $134,700 | |
| Closed | Habelt Stephen J | $133,000 |
Source: Public Records
Tax History
| Year | Tax Paid | Tax Assessment Tax Assessment Total Assessment is a certain percentage of the fair market value that is determined by local assessors to be the total taxable value of land and additions on the property. | Land | Improvement |
|---|---|---|---|---|
| 2025 | $61 | $506,600 | $147,500 | $359,100 |
| 2024 | $5,886 | $472,800 | $127,100 | $345,700 |
| 2023 | $5,636 | $426,300 | $127,100 | $299,200 |
| 2022 | $5,346 | $388,800 | $110,500 | $278,300 |
| 2021 | $5,196 | $363,900 | $105,200 | $258,700 |
| 2020 | $5,026 | $345,900 | $92,900 | $253,000 |
| 2019 | $4,882 | $333,500 | $92,900 | $240,600 |
| 2018 | $4,470 | $318,800 | $89,300 | $229,500 |
| 2017 | $4,347 | $304,000 | $100,100 | $203,900 |
| 2016 | $4,195 | $282,700 | $100,100 | $182,600 |
| 2015 | $3,969 | $285,300 | $100,100 | $185,200 |
| 2014 | $3,793 | $296,100 | $108,600 | $187,500 |
Source: Public Records
Map
Nearby Homes
- LOT 0 B Hudson Dr Unit B
- LOT 0 B Hudson Dr Unit B
- 2 Bc Ln
- 2 Lima Ln
- LOT 2A Hudson Dr Unit 2A
- 73 Seymour St
- 66 S Main St
- 0 Anthony St
- 106 Seymour St
- 23 Elmwood Dr
- 75 Sanford St
- 7 Eric Dr
- Lot B Old Anthony St
- 10 W Cudworth Ave
- 1969 County St
- 7 Tide Meadows Dr
- 31 Swing Dr
- 1064 Somerset Ave
- 143 Morrison Rd
- 300 Country Hill Dr
Your Personal Tour Guide
Ask me questions while you tour the home.