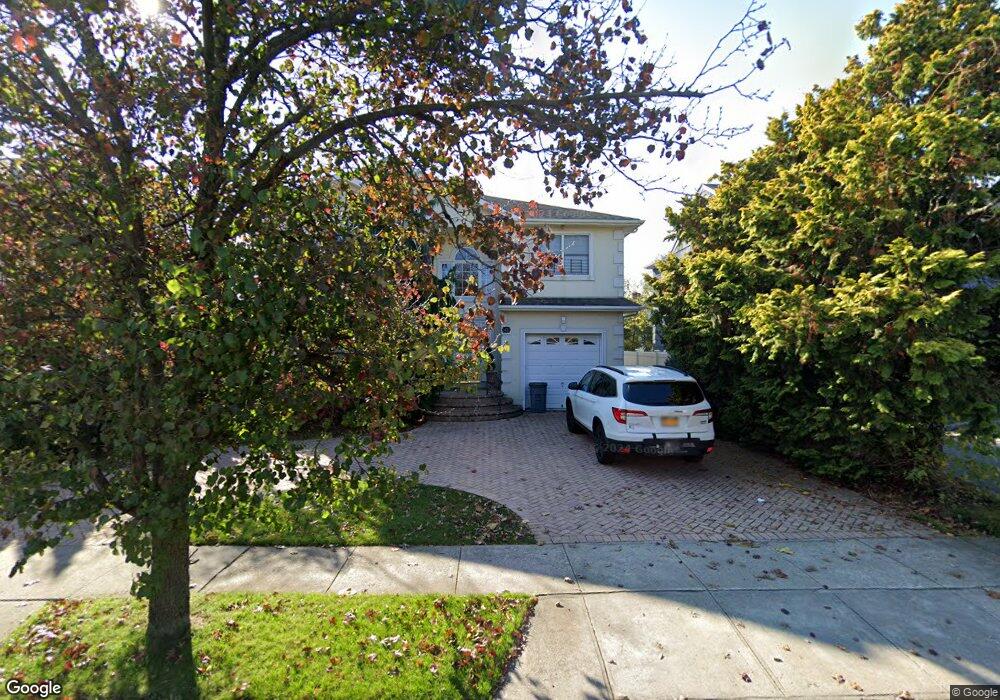
43 Maple Ave Cedarhurst, NY 11516
Estimated Value: $1,769,619 - $1,808,000
Studio
4
Baths
3,172
Sq Ft
$564/Sq Ft
Est. Value
About This Home
This home is located at 43 Maple Ave, Cedarhurst, NY 11516 and is currently estimated at $1,788,810, approximately $563 per square foot. 43 Maple Ave is a home located in Nassau County with nearby schools including Lawrence Elementary School, Lawrence Primary School, and Lawrence Middle School.
Ownership History
Date
Name
Owned For
Owner Type
Purchase Details
Closed on
Dec 16, 2009
Sold by
Stern Shai and Stern Michelle
Bought by
Porter Leon and Porter Brenda
Current Estimated Value
Home Financials for this Owner
Home Financials are based on the most recent Mortgage that was taken out on this home.
Original Mortgage
$600,000
Interest Rate
4.85%
Mortgage Type
Purchase Money Mortgage
Purchase Details
Closed on
Jan 8, 2007
Sold by
Stern Michelle
Purchase Details
Closed on
Aug 21, 2001
Purchase Details
Closed on
Jul 26, 1999
Sold by
Kamran Pourgol Realty Corp
Bought by
Stern Shai and Stern Michelle
Home Financials for this Owner
Home Financials are based on the most recent Mortgage that was taken out on this home.
Original Mortgage
$357,000
Interest Rate
9.99%
Mortgage Type
Purchase Money Mortgage
Purchase Details
Closed on
Dec 3, 1998
Create a Home Valuation Report for This Property
The Home Valuation Report is an in-depth analysis detailing your home's value as well as a comparison with similar homes in the area
Home Values in the Area
Average Home Value in this Area
Purchase History
| Date | Buyer | Sale Price | Title Company |
|---|---|---|---|
| Porter Leon | $890,000 | -- | |
| -- | -- | -- | |
| -- | -- | -- | |
| Stern Shai | $459,000 | First American Title Ins Co | |
| -- | $175,000 | -- |
Source: Public Records
Mortgage History
| Date | Status | Borrower | Loan Amount |
|---|---|---|---|
| Previous Owner | Porter Leon | $600,000 | |
| Previous Owner | Stern Shai | $357,000 |
Source: Public Records
Tax History
| Year | Tax Paid | Tax Assessment Tax Assessment Total Assessment is a certain percentage of the fair market value that is determined by local assessors to be the total taxable value of land and additions on the property. | Land | Improvement |
|---|---|---|---|---|
| 2025 | $14,569 | $1,037 | $343 | $694 |
| 2024 | $4,741 | $1,029 | $340 | $689 |
Source: Public Records
Map
Nearby Homes
- 8 Ventana Ct
- 463 Summit Ave Unit 2F
- 26 Carman Ave
- 8 Sealy Dr
- 272 Cedarhurst Ave Unit A6
- 279 Cedarhurst Ave Unit G-6
- 8 Stuyvesant Place
- 136 Linden St
- 487 5th Ave
- 219 Pearsall Place
- 376 Central Ave Unit 3-V
- 386 Mulry Ln
- 1 Meadow Dr Unit 3H-1
- 1 Meadow Dr Unit 3D
- 461 5th Ave
- 761 W Broadway
- 770 W Broadway
- 422 Cedarhurst Ave
- 365 Broadway
- 335 Summit Ave
Your Personal Tour Guide
Ask me questions while you tour the home.