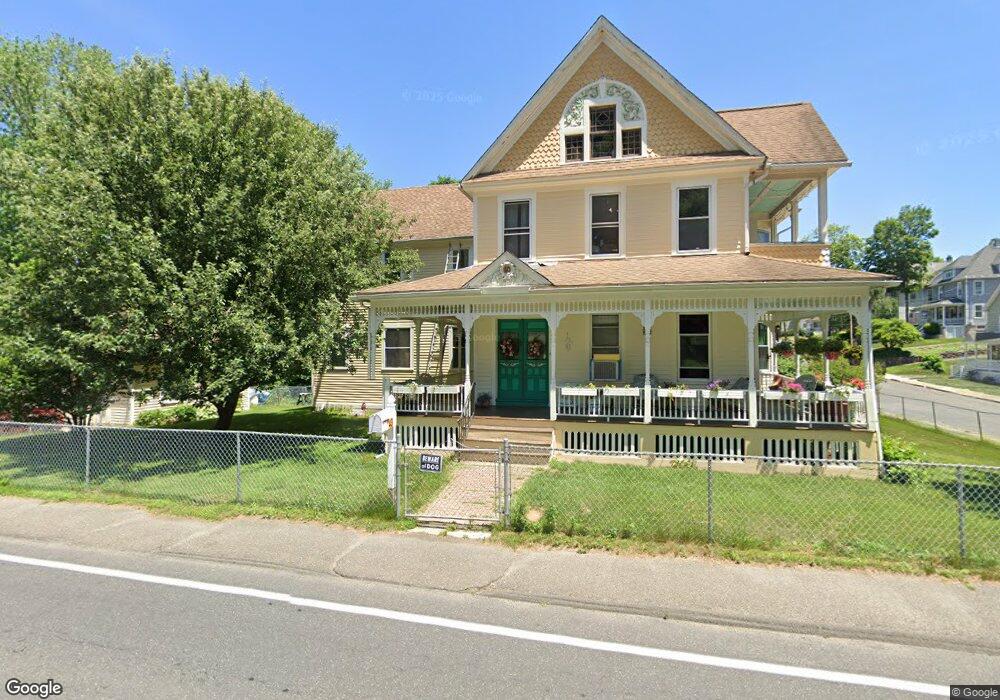
43 Maple St Seymour, CT 06483
Estimated Value: $463,269 - $635,000
4
Beds
3
Baths
3,518
Sq Ft
$154/Sq Ft
Est. Value
About This Home
This home is located at 43 Maple St, Seymour, CT 06483 and is currently estimated at $542,567, approximately $154 per square foot. 43 Maple St is a home located in New Haven County with nearby schools including Seymour Middle School, Seymour High School, and Assumption School.
Ownership History
Date
Name
Owned For
Owner Type
Purchase Details
Closed on
Jul 20, 2022
Sold by
Wilkin William P and Wilkin Patricia L
Bought by
P W
Current Estimated Value
Purchase Details
Closed on
Aug 3, 1976
Bought by
Wilkin William P and Wilkin Patricia L
Create a Home Valuation Report for This Property
The Home Valuation Report is an in-depth analysis detailing your home's value as well as a comparison with similar homes in the area
Home Values in the Area
Average Home Value in this Area
Purchase History
| Date | Buyer | Sale Price | Title Company |
|---|---|---|---|
| P W | -- | None Available | |
| P W P | -- | None Available | |
| Wilkin William P | -- | -- |
Source: Public Records
Mortgage History
| Date | Status | Borrower | Loan Amount |
|---|---|---|---|
| Previous Owner | Wilkin William P | $163,000 | |
| Previous Owner | Wilkin William P | $113,000 | |
| Previous Owner | Wilkin William P | $25,000 | |
| Previous Owner | Wilkin William P | $105,000 |
Source: Public Records
Tax History
| Year | Tax Paid | Tax Assessment Tax Assessment Total Assessment is a certain percentage of the fair market value that is determined by local assessors to be the total taxable value of land and additions on the property. | Land | Improvement |
|---|---|---|---|---|
| 2025 | $8,381 | $302,330 | $34,020 | $268,310 |
| 2024 | $8,288 | $224,980 | $27,440 | $197,540 |
| 2023 | $8,095 | $224,980 | $27,440 | $197,540 |
| 2022 | $8,007 | $224,980 | $27,440 | $197,540 |
| 2021 | $7,809 | $224,980 | $27,440 | $197,540 |
| 2020 | $7,270 | $201,950 | $32,270 | $169,680 |
| 2019 | $7,270 | $201,950 | $32,270 | $169,680 |
| 2018 | $7,270 | $201,950 | $32,270 | $169,680 |
| 2017 | $7,270 | $201,950 | $32,270 | $169,680 |
| 2016 | $7,270 | $201,950 | $32,270 | $169,680 |
| 2015 | $7,622 | $220,360 | $36,260 | $184,100 |
| 2014 | $7,501 | $220,360 | $36,260 | $184,100 |
Source: Public Records
Map
Nearby Homes
- 53 Maple St
- 122 Derby Ave
- 278 S Main St
- 50 Bissell Place
- 18 Bryson Ave
- 73 Micko Dr
- 48 Micko Dr
- 68 New St
- 32 George St
- 17 Patton Ave
- 28 Elmwood Dr
- 11 Poplar Dr
- 17 Meadow St Unit 23
- 93 Balance Rock Rd Unit 1
- 37-14, 49-1, 79-2, 7 Balance Rock Rd
- 35 Cogwheel Ln
- 24 Deer Run Dr
- 29 Balance Rock Rd Unit 5
- 75 Balance Rock Rd Unit 20
- 41 Balance Rock Rd Unit 16
Your Personal Tour Guide
Ask me questions while you tour the home.