A
Seller's Agent in 2025
Alvarenga & Son's Team
Keller Williams Realty Evolution
Estimated Value: $286,000 - $405,000
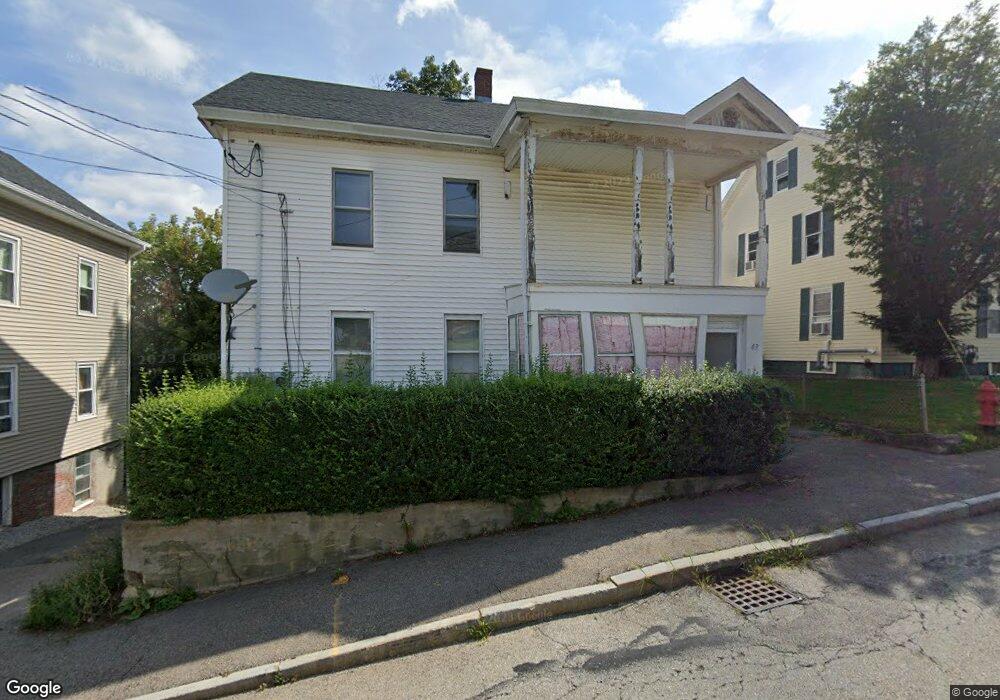
Welcome to your newly renovated, multi-level 3-bedroom gem, boasting modern updates and ample space for comfortable living. With a convenient driveway, parking is a breeze. Move right in and experience the perfect blend of style, functionality, and convenience.
| Date | Buyer | Sale Price | Title Company |
|---|---|---|---|
| 2943 Church Maple St Llc | -- | None Available | |
| 2943 Church Maple St Llc | -- | None Available | |
| Vieira Ademar | $165,000 | None Available | |
| Survivors T T | -- | None Available | |
| Survivors T T | -- | None Available | |
| Mosher Tr Frank N | -- | -- | |
| Mosher Tr Frank N | -- | -- | |
| Mosher Frank N | $55,000 | -- | |
| Mosher Frank N | $55,000 | -- |
| Date | Status | Borrower | Loan Amount |
|---|---|---|---|
| Previous Owner | Vieira Ademar | $333,000 | |
| Previous Owner | Mosher Frank N | $38,500 | |
| Previous Owner | Mosher Frank N | $85,000 |
| Date | Event | Price | List to Sale | Price per Sq Ft |
|---|---|---|---|---|
| 10/28/2025 10/28/25 | For Rent | $2,200 | -- | -- |
| Year | Tax Paid | Tax Assessment Tax Assessment Total Assessment is a certain percentage of the fair market value that is determined by local assessors to be the total taxable value of land and additions on the property. | Land | Improvement |
|---|---|---|---|---|
| 2025 | $24 | $201,800 | $31,900 | $169,900 |
| 2024 | $2,758 | $241,100 | $31,900 | $209,200 |
| 2023 | $2,628 | $217,900 | $31,900 | $186,000 |
| 2022 | $2,639 | $200,500 | $29,000 | $171,500 |
| 2021 | $2,266 | $161,400 | $29,000 | $132,400 |
| 2020 | $2,158 | $152,800 | $29,000 | $123,800 |
| 2019 | $2,017 | $145,500 | $26,100 | $119,400 |
| 2018 | $1,853 | $138,100 | $30,400 | $107,700 |
| 2017 | $1,911 | $136,700 | $29,000 | $107,700 |
| 2016 | $1,823 | $127,600 | $29,000 | $98,600 |
| 2015 | $1,866 | $136,500 | $36,400 | $100,100 |
| 2014 | $1,795 | $136,500 | $36,400 | $100,100 |
A
Seller's Agent in 2025
Alvarenga & Son's Team
Keller Williams Realty Evolution
S
Seller Co-Listing Agent in 2025
Samuel Alvarenga
Keller Williams Realty Evolution
Ask me questions while you tour the home.
