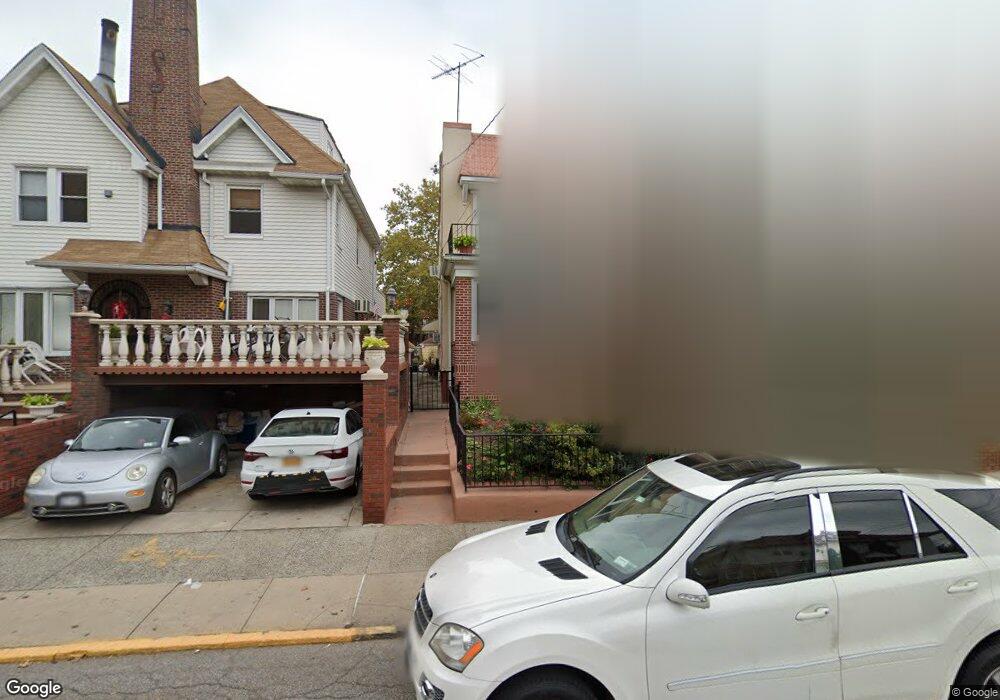
43 Marine Ave Brooklyn, NY 11209
Fort Hamilton NeighborhoodEstimated Value: $1,466,656 - $1,684,000
--
Bed
--
Bath
2,164
Sq Ft
$735/Sq Ft
Est. Value
About This Home
This home is located at 43 Marine Ave, Brooklyn, NY 11209 and is currently estimated at $1,591,414, approximately $735 per square foot. 43 Marine Ave is a home located in Kings County with nearby schools including P.S. 185 Walter Kassenbrock, P.S./I.S. 104 The Fort Hamilton School, and Fort Hamilton High School.
Ownership History
Date
Name
Owned For
Owner Type
Purchase Details
Closed on
Feb 17, 2010
Sold by
Fares Ghassan
Bought by
Almawaldi Mazen
Current Estimated Value
Home Financials for this Owner
Home Financials are based on the most recent Mortgage that was taken out on this home.
Original Mortgage
$743,792
Outstanding Balance
$486,356
Interest Rate
4.87%
Mortgage Type
FHA
Estimated Equity
$1,105,058
Purchase Details
Closed on
Jun 9, 2005
Sold by
Cangiano James and Cangiano Jerry
Bought by
Fares Ghassan
Home Financials for this Owner
Home Financials are based on the most recent Mortgage that was taken out on this home.
Original Mortgage
$668,000
Interest Rate
5.82%
Mortgage Type
Purchase Money Mortgage
Purchase Details
Closed on
Feb 1, 2005
Sold by
Cangiano James and Cangiano Jerry
Bought by
Cangiano James and Cangiano Jerry
Purchase Details
Closed on
May 5, 1997
Sold by
Morelli Louise
Bought by
Morelli Louise and Cangiano Pauline
Create a Home Valuation Report for This Property
The Home Valuation Report is an in-depth analysis detailing your home's value as well as a comparison with similar homes in the area
Home Values in the Area
Average Home Value in this Area
Purchase History
| Date | Buyer | Sale Price | Title Company |
|---|---|---|---|
| Almawaldi Mazen | $880,000 | -- | |
| Almawaldi Mazen | $880,000 | -- | |
| Fares Ghassan | $835,000 | -- | |
| Fares Ghassan | $835,000 | -- | |
| Cangiano James | -- | -- | |
| Cangiano James | -- | -- | |
| Morelli Louise | -- | Chicago Title Insurance Co | |
| Morelli Louise | -- | Chicago Title Insurance Co |
Source: Public Records
Mortgage History
| Date | Status | Borrower | Loan Amount |
|---|---|---|---|
| Open | Almawaldi Mazen | $743,792 | |
| Closed | Almawaldi Mazen | $743,792 | |
| Previous Owner | Fares Ghassan | $668,000 |
Source: Public Records
Tax History Compared to Growth
Tax History
| Year | Tax Paid | Tax Assessment Tax Assessment Total Assessment is a certain percentage of the fair market value that is determined by local assessors to be the total taxable value of land and additions on the property. | Land | Improvement |
|---|---|---|---|---|
| 2025 | $12,474 | $98,700 | $17,100 | $81,600 |
| 2024 | $12,474 | $82,800 | $17,100 | $65,700 |
| 2023 | $11,884 | $93,540 | $17,100 | $76,440 |
| 2022 | $11,038 | $78,060 | $17,100 | $60,960 |
| 2021 | $11,560 | $68,640 | $17,100 | $51,540 |
| 2020 | $5,721 | $77,340 | $17,100 | $60,240 |
| 2019 | $10,778 | $77,340 | $17,100 | $60,240 |
| 2018 | $9,881 | $49,932 | $11,504 | $38,428 |
| 2017 | $9,338 | $47,277 | $12,182 | $35,095 |
| 2016 | $9,075 | $46,945 | $13,339 | $33,606 |
| 2015 | $5,160 | $46,749 | $15,534 | $31,215 |
| 2014 | $5,160 | $44,103 | $16,824 | $27,279 |
Source: Public Records
Map
Nearby Homes
- 9430 Ridge Blvd Unit 1F
- 9430 Ridge Blvd Unit 6F
- 9430 Ridge Blvd Unit 4E
- 57 Marine Ave
- 9452 Ridge Blvd
- 125 93rd St
- 227 94th St
- 9204 Ridge Blvd
- 9323 Shore Rd Unit 4G
- 13 Marine Ave
- 9411 Shore Rd Unit 1O
- 9411 Shore Rd Unit 6M
- 9281 Shore Rd Unit 608
- 9281 Shore Rd Unit 402
- 9281 Shore Rd Unit 602
- 61 Oliver St Unit 6F
- 61 Oliver St Unit 1T
- 61 Oliver St Unit 4-P
- 61 Oliver St Unit 5B
- 61 Oliver St Unit 2V