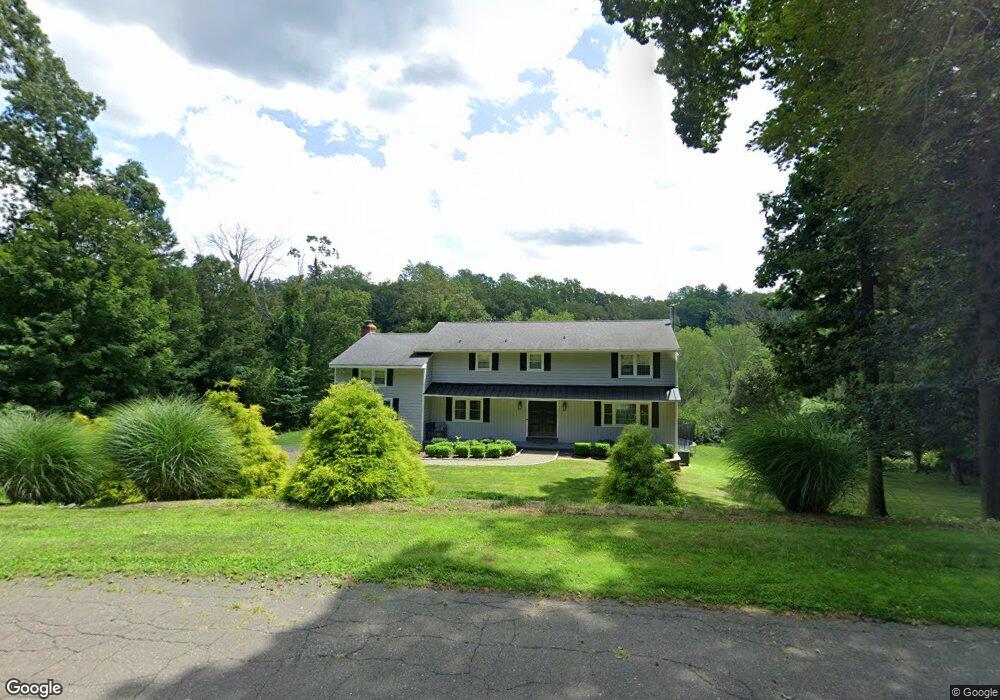
43 Marshall Rd Ridgefield, CT 06877
Estimated Value: $991,000 - $1,507,000
5
Beds
3
Baths
3,294
Sq Ft
$391/Sq Ft
Est. Value
About This Home
This home is located at 43 Marshall Rd, Ridgefield, CT 06877 and is currently estimated at $1,288,370, approximately $391 per square foot. 43 Marshall Rd is a home located in Fairfield County with nearby schools including Veterans Park Elementary School, Ridgefield High School, and St. Mary School.
Ownership History
Date
Name
Owned For
Owner Type
Purchase Details
Closed on
Aug 9, 2007
Sold by
Caruso Robert and Caruso Karen
Bought by
Constantine Anthony P and Constantine Danielle C
Current Estimated Value
Home Financials for this Owner
Home Financials are based on the most recent Mortgage that was taken out on this home.
Original Mortgage
$642,800
Outstanding Balance
$408,235
Interest Rate
6.72%
Estimated Equity
$880,135
Purchase Details
Closed on
Oct 30, 2001
Sold by
Berkowitz Wayne M and Berkowitz Lori R
Bought by
Caruso Robert
Purchase Details
Closed on
Aug 21, 1998
Sold by
Riegel Daniel W and Riegel Janis L
Bought by
Berkowitz Wayne M and Berkowitz Lori R
Purchase Details
Closed on
Nov 29, 1995
Sold by
Stankewich Michael J and Stankewich Caryn M
Bought by
Riegel Daniel W and Riegel Janis L
Create a Home Valuation Report for This Property
The Home Valuation Report is an in-depth analysis detailing your home's value as well as a comparison with similar homes in the area
Home Values in the Area
Average Home Value in this Area
Purchase History
| Date | Buyer | Sale Price | Title Company |
|---|---|---|---|
| Constantine Anthony P | $803,500 | -- | |
| Caruso Robert | $595,000 | -- | |
| Berkowitz Wayne M | $478,000 | -- | |
| Riegel Daniel W | $414,500 | -- |
Source: Public Records
Mortgage History
| Date | Status | Borrower | Loan Amount |
|---|---|---|---|
| Open | Riegel Daniel W | $642,800 | |
| Closed | Riegel Daniel W | $80,350 | |
| Previous Owner | Riegel Daniel W | $521,250 |
Source: Public Records
Tax History
| Year | Tax Paid | Tax Assessment Tax Assessment Total Assessment is a certain percentage of the fair market value that is determined by local assessors to be the total taxable value of land and additions on the property. | Land | Improvement |
|---|---|---|---|---|
| 2025 | $17,191 | $627,620 | $332,500 | $295,120 |
| 2024 | $16,538 | $627,620 | $332,500 | $295,120 |
| 2023 | $16,199 | $627,620 | $332,500 | $295,120 |
| 2022 | $13,440 | $472,730 | $239,400 | $233,330 |
| 2021 | $13,336 | $472,730 | $239,400 | $233,330 |
| 2020 | $13,293 | $472,730 | $239,400 | $233,330 |
| 2019 | $13,293 | $472,730 | $239,400 | $233,330 |
| 2018 | $13,132 | $472,730 | $239,400 | $233,330 |
| 2017 | $13,060 | $479,980 | $210,670 | $269,310 |
| 2016 | $12,811 | $479,980 | $210,670 | $269,310 |
| 2015 | $12,484 | $479,980 | $210,670 | $269,310 |
| 2014 | $12,484 | $479,980 | $210,670 | $269,310 |
Source: Public Records
Map
Nearby Homes
- 77 Golf Ln
- 6 Sycamore Ln
- 452 Silver Spring Rd
- 27 Country Club Rd
- 84 Olmstead Ln
- 159 Barry Ave
- 71 Peaceable Ridge Rd
- 384 West Ln
- 23 Olmstead Ln
- 26 Abbott Ave
- 94 Soundview Rd
- 19 Cook Close Unit 19
- 75A New St
- 75 New St
- 8 Stebbins Close Unit 8
- 75 Lawson Ln
- 59 Prospect St Unit C
- 32 Lawson Ln
- 8 West Ln
- 55 Olcott Way
Your Personal Tour Guide
Ask me questions while you tour the home.