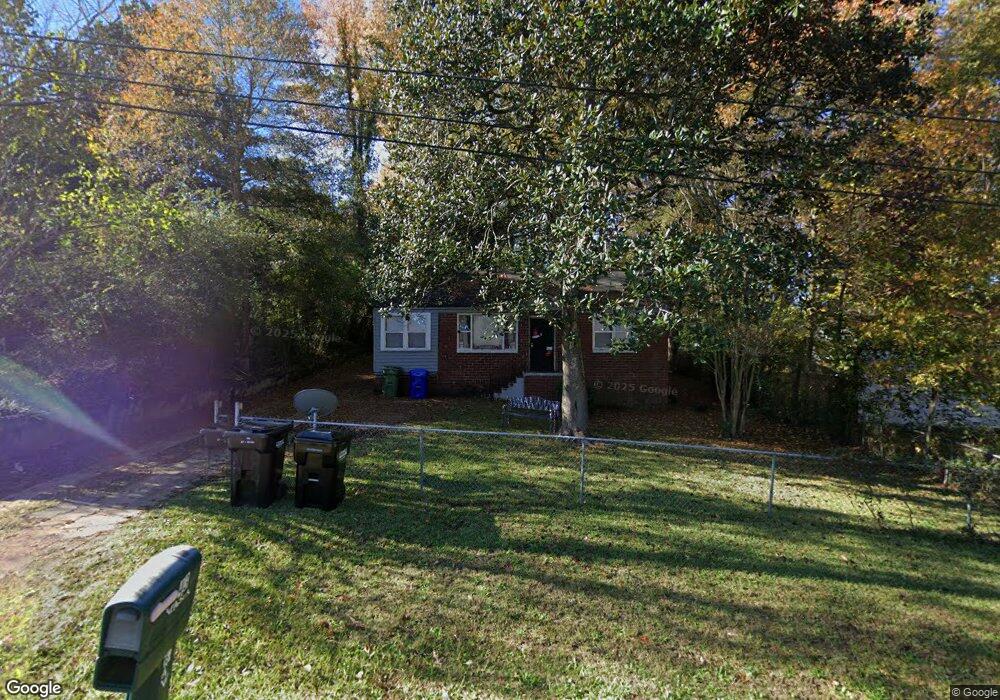
43 Mason Dr Columbus, GA 31903
Southern Columbus NeighborhoodEstimated Value: $47,000 - $74,000
2
Beds
2
Baths
936
Sq Ft
$63/Sq Ft
Est. Value
About This Home
This home is located at 43 Mason Dr, Columbus, GA 31903 and is currently estimated at $59,186, approximately $63 per square foot. 43 Mason Dr is a home located in Muscogee County with nearby schools including Glenallen Elementary School, South Columbus Elementary School, and Eddy Middle School.
Ownership History
Date
Name
Owned For
Owner Type
Purchase Details
Closed on
Dec 20, 2011
Sold by
Big Mamas Stuff Llc
Bought by
Jjw Investments Co Llc
Current Estimated Value
Purchase Details
Closed on
Oct 12, 2011
Sold by
Hilton Janna
Bought by
Big Mamas Stuff Llc
Purchase Details
Closed on
Apr 5, 2011
Sold by
Midfirst Bank
Bought by
Sec Of Veterans Affairs
Create a Home Valuation Report for This Property
The Home Valuation Report is an in-depth analysis detailing your home's value as well as a comparison with similar homes in the area
Home Values in the Area
Average Home Value in this Area
Purchase History
| Date | Buyer | Sale Price | Title Company |
|---|---|---|---|
| Jjw Investments Co Llc | $10,000 | -- | |
| Big Mamas Stuff Llc | -- | -- | |
| Hilton Janna | -- | -- | |
| Sec Of Veterans Affairs | $19,830 | -- | |
| Midfirst Bank | $19,830 | -- |
Source: Public Records
Tax History Compared to Growth
Tax History
| Year | Tax Paid | Tax Assessment Tax Assessment Total Assessment is a certain percentage of the fair market value that is determined by local assessors to be the total taxable value of land and additions on the property. | Land | Improvement |
|---|---|---|---|---|
| 2025 | $940 | $24,020 | $4,704 | $19,316 |
| 2024 | $487 | $12,437 | $3,476 | $8,961 |
| 2023 | $490 | $12,437 | $3,476 | $8,961 |
| 2022 | $470 | $16,304 | $3,476 | $12,828 |
| 2021 | $470 | $11,516 | $3,476 | $8,040 |
| 2020 | $470 | $11,516 | $3,476 | $8,040 |
| 2019 | $472 | $11,516 | $3,476 | $8,040 |
| 2018 | $472 | $11,516 | $3,476 | $8,040 |
| 2017 | $473 | $11,516 | $3,476 | $8,040 |
| 2016 | $547 | $13,268 | $2,153 | $11,115 |
| 2015 | $548 | $13,268 | $2,153 | $11,115 |
| 2014 | $549 | $13,268 | $2,153 | $11,115 |
| 2013 | $549 | $13,268 | $2,153 | $11,115 |
Source: Public Records
Map
Nearby Homes