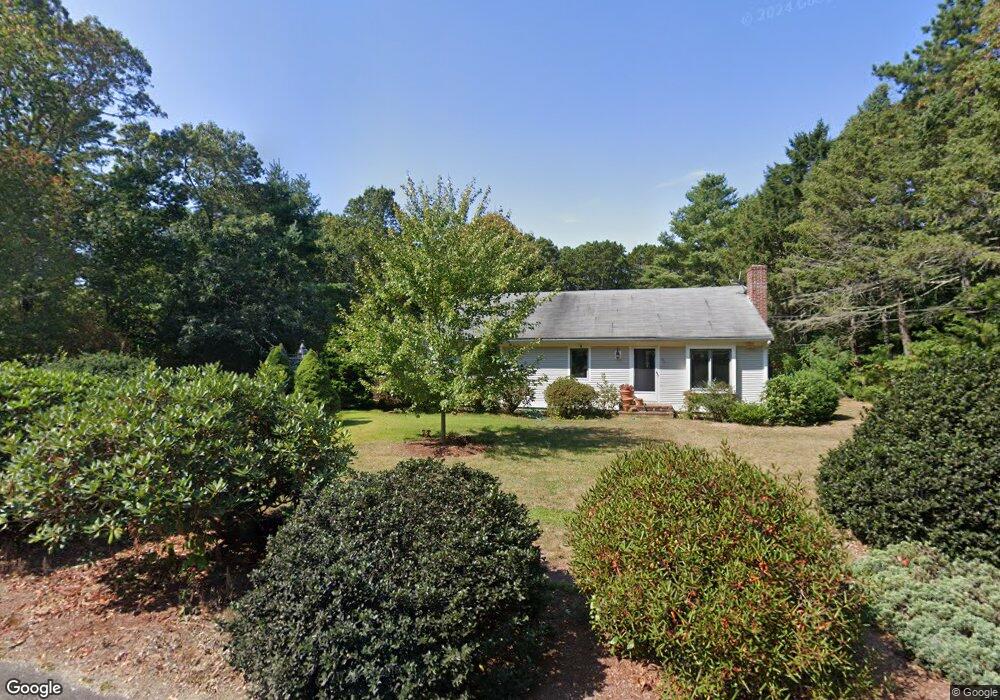
43 Matthew Way Marstons Mills, MA 02648
Marstons Mills NeighborhoodEstimated Value: $540,000 - $616,000
3
Beds
2
Baths
1,040
Sq Ft
$547/Sq Ft
Est. Value
About This Home
This home is located at 43 Matthew Way, Marstons Mills, MA 02648 and is currently estimated at $568,811, approximately $546 per square foot. 43 Matthew Way is a home located in Barnstable County with nearby schools including Barnstable United Elementary School, West Barnstable Elementary School, and Barnstable Intermediate School.
Ownership History
Date
Name
Owned For
Owner Type
Purchase Details
Closed on
Jul 31, 1990
Sold by
Realty Funding Corp
Bought by
Cote Louise J
Current Estimated Value
Home Financials for this Owner
Home Financials are based on the most recent Mortgage that was taken out on this home.
Original Mortgage
$76,800
Interest Rate
10.01%
Mortgage Type
Purchase Money Mortgage
Purchase Details
Closed on
Jun 1, 1990
Sold by
Adam Joan M
Bought by
Realty Funding Corp
Home Financials for this Owner
Home Financials are based on the most recent Mortgage that was taken out on this home.
Original Mortgage
$76,800
Interest Rate
10.01%
Mortgage Type
Purchase Money Mortgage
Create a Home Valuation Report for This Property
The Home Valuation Report is an in-depth analysis detailing your home's value as well as a comparison with similar homes in the area
Home Values in the Area
Average Home Value in this Area
Purchase History
| Date | Buyer | Sale Price | Title Company |
|---|---|---|---|
| Cote Louise J | $96,000 | -- | |
| Realty Funding Corp | $65,000 | -- |
Source: Public Records
Mortgage History
| Date | Status | Borrower | Loan Amount |
|---|---|---|---|
| Closed | Realty Funding Corp | $76,800 |
Source: Public Records
Tax History Compared to Growth
Tax History
| Year | Tax Paid | Tax Assessment Tax Assessment Total Assessment is a certain percentage of the fair market value that is determined by local assessors to be the total taxable value of land and additions on the property. | Land | Improvement |
|---|---|---|---|---|
| 2025 | $3,600 | $445,000 | $173,400 | $271,600 |
| 2024 | $3,455 | $442,400 | $173,400 | $269,000 |
| 2023 | $3,265 | $391,500 | $157,600 | $233,900 |
| 2022 | $3,067 | $318,200 | $116,800 | $201,400 |
| 2021 | $3,083 | $281,700 | $116,800 | $164,900 |
| 2020 | $3,033 | $276,700 | $116,800 | $159,900 |
| 2019 | $2,920 | $258,900 | $116,800 | $142,100 |
| 2018 | $0 | $241,000 | $122,900 | $118,100 |
| 2017 | $2,403 | $235,500 | $122,900 | $112,600 |
| 2016 | $2,541 | $233,100 | $120,500 | $112,600 |
| 2015 | $2,513 | $231,600 | $121,800 | $109,800 |
Source: Public Records
Map
Nearby Homes