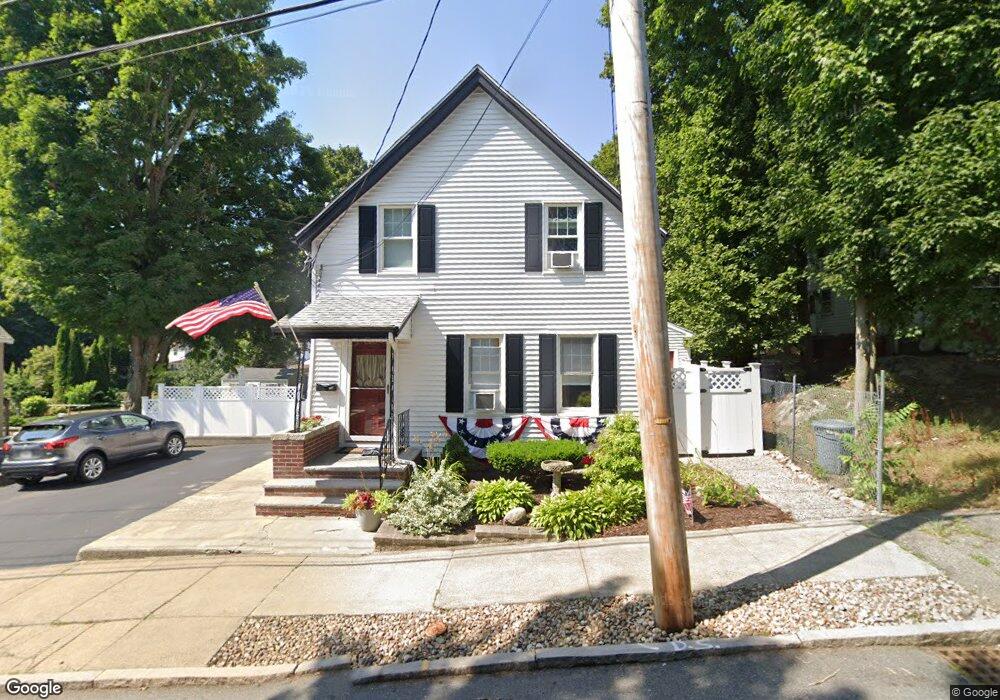
43 Melvin St Wakefield, MA 01880
East Side NeighborhoodEstimated Value: $850,000 - $929,000
5
Beds
2
Baths
2,773
Sq Ft
$323/Sq Ft
Est. Value
About This Home
This home is located at 43 Melvin St, Wakefield, MA 01880 and is currently estimated at $894,948, approximately $322 per square foot. 43 Melvin St is a home located in Middlesex County with nearby schools including Wakefield Memorial High School, St Joseph School, and Odyssey Day School.
Ownership History
Date
Name
Owned For
Owner Type
Purchase Details
Closed on
Jul 27, 2009
Sold by
Fabbri Louis A and Fabbri Judith A
Bought by
Kostopoulos Angela B
Current Estimated Value
Home Financials for this Owner
Home Financials are based on the most recent Mortgage that was taken out on this home.
Original Mortgage
$313,600
Outstanding Balance
$208,293
Interest Rate
5.58%
Mortgage Type
Purchase Money Mortgage
Estimated Equity
$686,655
Create a Home Valuation Report for This Property
The Home Valuation Report is an in-depth analysis detailing your home's value as well as a comparison with similar homes in the area
Home Values in the Area
Average Home Value in this Area
Purchase History
| Date | Buyer | Sale Price | Title Company |
|---|---|---|---|
| Kostopoulos Angela B | $392,000 | -- |
Source: Public Records
Mortgage History
| Date | Status | Borrower | Loan Amount |
|---|---|---|---|
| Open | Kostopoulos Angela B | $313,600 |
Source: Public Records
Tax History
| Year | Tax Paid | Tax Assessment Tax Assessment Total Assessment is a certain percentage of the fair market value that is determined by local assessors to be the total taxable value of land and additions on the property. | Land | Improvement |
|---|---|---|---|---|
| 2025 | $9,176 | $808,500 | $379,400 | $429,100 |
| 2024 | $9,044 | $803,900 | $377,200 | $426,700 |
| 2023 | $8,599 | $733,100 | $344,000 | $389,100 |
| 2022 | $8,227 | $667,800 | $313,300 | $354,500 |
| 2021 | $7,870 | $618,200 | $292,100 | $326,100 |
| 2020 | $7,379 | $577,800 | $273,000 | $304,800 |
| 2019 | $7,049 | $549,400 | $259,600 | $289,800 |
| 2018 | $6,564 | $506,900 | $239,500 | $267,400 |
| 2017 | $6,171 | $506,900 | $239,500 | $267,400 |
| 2016 | $5,737 | $425,300 | $211,700 | $213,600 |
| 2015 | $5,357 | $397,400 | $197,800 | $199,600 |
| 2014 | $4,885 | $382,200 | $190,200 | $192,000 |
Source: Public Records
Map
Nearby Homes
- 38 Bennett St Unit 3D
- 0 Everett St
- 68 Preston St Unit 6D
- 43-45 Crescent St
- 16 Pleasant St
- 1 Sidney St
- 62 Foundry St Unit 310
- 62 Foundry St Unit 312
- 62 Foundry St Unit 204
- 62 Foundry St Unit 202
- 62 Foundry St Unit 208
- 62 Foundry St Unit 414
- 69 Foundry St Unit 310
- 69 Foundry St Unit 416
- 177 Oak St
- 252 Albion St Unit 3
- 248 Albion St Unit 231
- 248 Albion St Unit 321
- 70 Old Nahant Rd
- 824 Main St Unit 1
- 43 Melvin St Unit A
- 41 Melvin St Unit 2
- 41 Melvin St Unit 1
- 41 Melvin St Unit B
- 45 Melvin St
- 44 Melvin St
- 42 Melvin St
- 39 Melvin St
- 13 Cottage St
- 13 Cottage St Unit 1
- 47 Melvin St
- 22 Herbert St
- 46 Melvin St
- 38 Melvin St
- 70 Bennett St
- 20 Herbert St
- 24 Herbert St
- 18 Herbert St
- 51 Melvin St
- 50 Melvin St
Your Personal Tour Guide
Ask me questions while you tour the home.