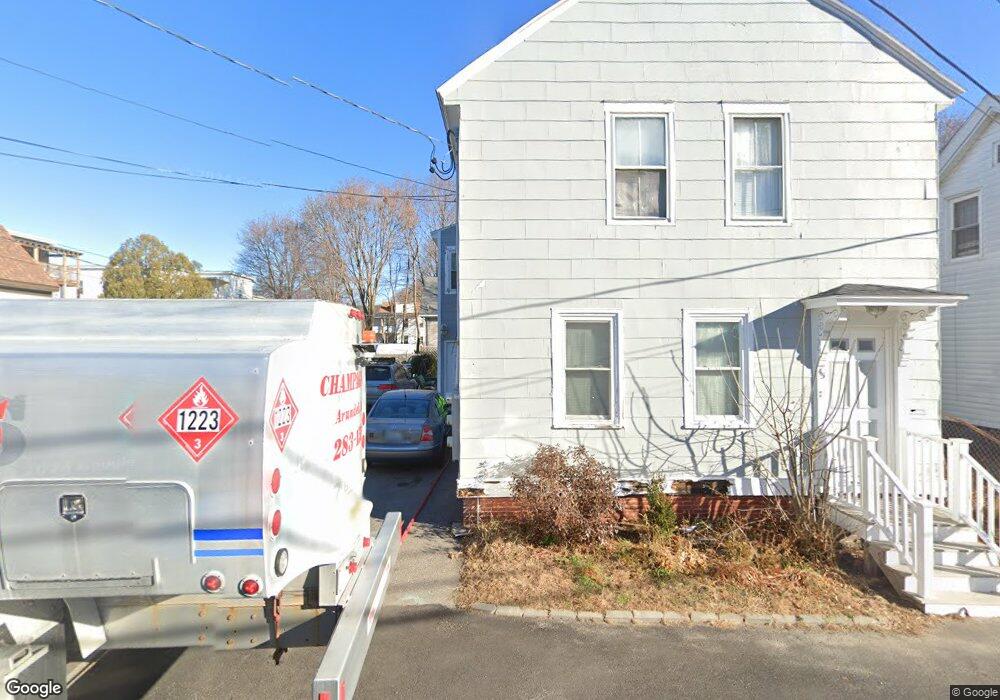
43 Myrtle St Biddeford, ME 04005
Estimated Value: $333,484 - $389,000
3
Beds
1
Bath
1,312
Sq Ft
$276/Sq Ft
Est. Value
About This Home
This home is located at 43 Myrtle St, Biddeford, ME 04005 and is currently estimated at $362,121, approximately $276 per square foot. 43 Myrtle St is a home located in York County with nearby schools including John F Kennedy Memorial School, Biddeford Primary School, and Biddeford Intermediate School.
Ownership History
Date
Name
Owned For
Owner Type
Purchase Details
Closed on
Mar 28, 2006
Sold by
Cadorette Richard R
Bought by
Asali Stacy L and Asali George A
Current Estimated Value
Home Financials for this Owner
Home Financials are based on the most recent Mortgage that was taken out on this home.
Original Mortgage
$145,200
Outstanding Balance
$83,056
Interest Rate
6.28%
Mortgage Type
Purchase Money Mortgage
Estimated Equity
$279,065
Create a Home Valuation Report for This Property
The Home Valuation Report is an in-depth analysis detailing your home's value as well as a comparison with similar homes in the area
Home Values in the Area
Average Home Value in this Area
Purchase History
| Date | Buyer | Sale Price | Title Company |
|---|---|---|---|
| Asali Stacy L | -- | -- |
Source: Public Records
Mortgage History
| Date | Status | Borrower | Loan Amount |
|---|---|---|---|
| Open | Asali Stacy L | $145,200 |
Source: Public Records
Tax History
| Year | Tax Paid | Tax Assessment Tax Assessment Total Assessment is a certain percentage of the fair market value that is determined by local assessors to be the total taxable value of land and additions on the property. | Land | Improvement |
|---|---|---|---|---|
| 2024 | $2,993 | $210,500 | $108,800 | $101,700 |
| 2023 | $2,762 | $210,500 | $108,800 | $101,700 |
| 2022 | $2,594 | $158,100 | $52,600 | $105,500 |
| 2021 | $2,434 | $133,500 | $43,900 | $89,600 |
| 2020 | $2,414 | $120,400 | $37,300 | $83,100 |
| 2019 | $2,406 | $120,400 | $37,300 | $83,100 |
| 2018 | $2,372 | $120,400 | $37,300 | $83,100 |
| 2017 | $2,286 | $113,900 | $37,300 | $76,600 |
| 2016 | $2,262 | $113,900 | $37,300 | $76,600 |
| 2015 | $2,218 | $113,900 | $37,300 | $76,600 |
| 2014 | $2,163 | $113,900 | $37,300 | $76,600 |
| 2013 | -- | $135,700 | $46,500 | $89,200 |
Source: Public Records
Map
Nearby Homes
- 155 Hill St
- 93 Summer St
- 17 Granite St
- 12 Sheltra Ave
- 5 Oak Place
- 36-38 Pool St
- 7 Willett St
- 66 Graham St
- 11 King St
- 84 Pike St
- 2 Free St
- 16 Hill St
- 4 Kossuth St
- 11 Chadwick Place
- 2 Main St Unit 17-502
- 2 Main St Unit 15-311
- 2 Main St Unit 17-407
- 2 Main St Unit 18-420
- 2 Main St Unit 15-507
- 2 Main St Unit 18-421