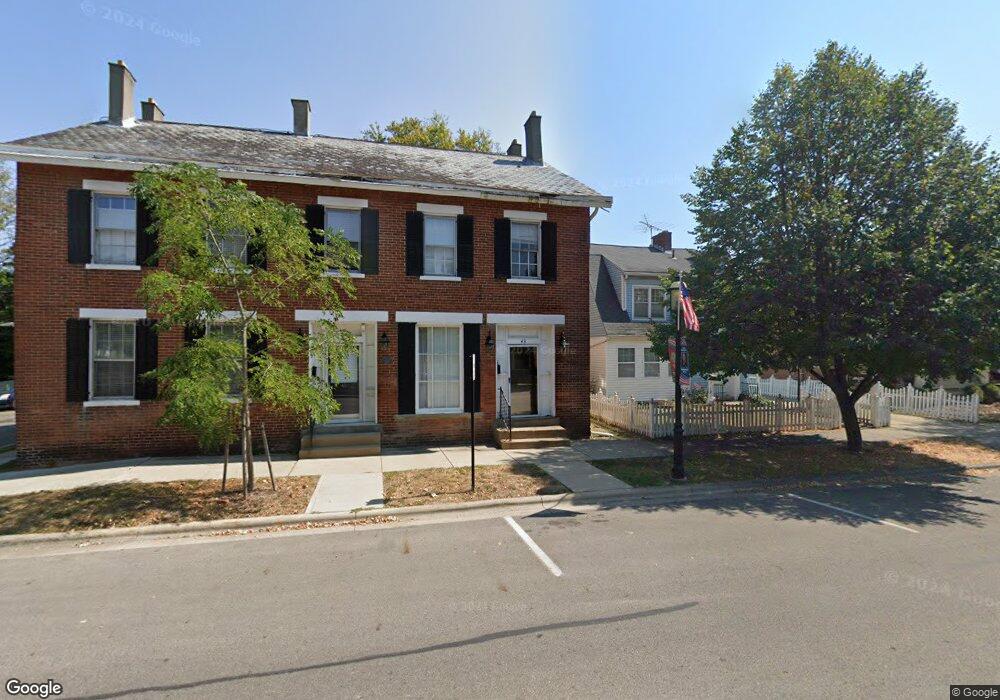
43 N High St Canal Winchester, OH 43110
Estimated Value: $282,000 - $320,000
6
Beds
3
Baths
4,528
Sq Ft
$66/Sq Ft
Est. Value
About This Home
This home is located at 43 N High St, Canal Winchester, OH 43110 and is currently estimated at $301,000, approximately $66 per square foot. 43 N High St is a home located in Franklin County with nearby schools including Winchester Trail Elementary School, Indian Trail Elementary School, and Canal Winchester Middle School.
Ownership History
Date
Name
Owned For
Owner Type
Purchase Details
Closed on
Dec 12, 2011
Sold by
Makdrew Ii Llc
Bought by
Makdrew Development Company Ltd
Current Estimated Value
Home Financials for this Owner
Home Financials are based on the most recent Mortgage that was taken out on this home.
Original Mortgage
$180,000
Outstanding Balance
$72,359
Interest Rate
4.02%
Mortgage Type
Purchase Money Mortgage
Estimated Equity
$228,641
Purchase Details
Closed on
Nov 18, 2008
Sold by
Vanfossen Edith W
Bought by
Makdrew Ii Llc
Home Financials for this Owner
Home Financials are based on the most recent Mortgage that was taken out on this home.
Original Mortgage
$137,000
Interest Rate
6.09%
Mortgage Type
Seller Take Back
Purchase Details
Closed on
Jul 19, 1990
Bought by
Vanfossen Edith W Tr
Purchase Details
Closed on
Dec 1, 1979
Create a Home Valuation Report for This Property
The Home Valuation Report is an in-depth analysis detailing your home's value as well as a comparison with similar homes in the area
Home Values in the Area
Average Home Value in this Area
Purchase History
| Date | Buyer | Sale Price | Title Company |
|---|---|---|---|
| Makdrew Development Company Ltd | -- | Cardinal Ti | |
| Makdrew Ii Llc | $137,000 | Cardinal Ti | |
| Vanfossen Edith W Tr | -- | -- | |
| -- | $16,500 | -- |
Source: Public Records
Mortgage History
| Date | Status | Borrower | Loan Amount |
|---|---|---|---|
| Open | Makdrew Development Company Ltd | $180,000 | |
| Previous Owner | Makdrew Ii Llc | $137,000 |
Source: Public Records
Tax History Compared to Growth
Tax History
| Year | Tax Paid | Tax Assessment Tax Assessment Total Assessment is a certain percentage of the fair market value that is determined by local assessors to be the total taxable value of land and additions on the property. | Land | Improvement |
|---|---|---|---|---|
| 2024 | $11,630 | $203,430 | $18,870 | $184,560 |
| 2023 | $11,567 | $203,420 | $18,865 | $184,555 |
| 2022 | $5,709 | $84,670 | $9,660 | $75,010 |
| 2021 | $5,770 | $84,670 | $9,660 | $75,010 |
| 2020 | $5,758 | $84,670 | $9,660 | $75,010 |
| 2019 | $3,802 | $70,560 | $8,050 | $62,510 |
| 2018 | $3,905 | $70,560 | $8,050 | $62,510 |
| 2017 | $3,903 | $70,560 | $8,050 | $62,510 |
| 2016 | $4,073 | $57,510 | $8,960 | $48,550 |
| 2015 | $4,084 | $57,510 | $8,960 | $48,550 |
| 2014 | $3,829 | $57,510 | $8,960 | $48,550 |
| 2013 | $1,892 | $48,195 | $8,960 | $39,235 |
Source: Public Records
Map
Nearby Homes
- 8200 Alban Woods Way NW
- 8256 Alban Woods Way NW
- 94 W Waterloo St
- 141 W Waterloo St
- 185 Groveport Pike Unit 11A
- 185 Groveport Pike Unit 14D
- 180 Woodsview Dr
- 6575 Turning Stone Loop
- 216 Washington St
- 237 Chaney Mill Way
- 6446 Turning Stone Loop
- 295 Old Coach Place
- 359 W Waterloo St
- 369 W Waterloo St
- 338 Chesterville Dr
- 7412 Connor Ct
- 6641 Steen St
- 0 Chesterville Dr Unit 225032463
- 7288 Bromfield Dr
- 7362 Bromfield Dr