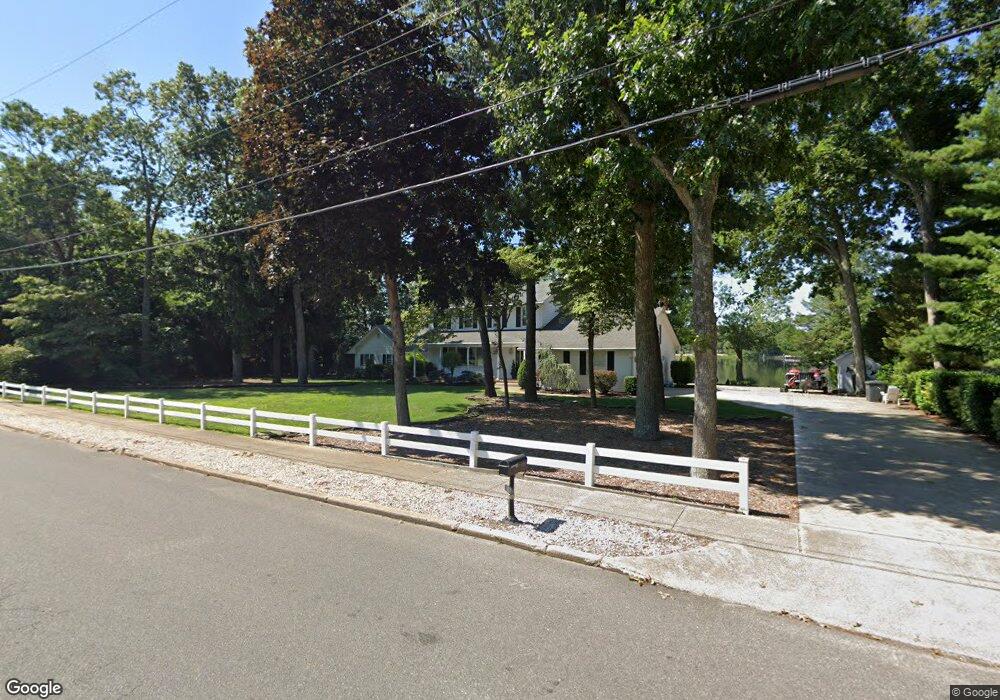
43 N Lakeshore Dr (Lakefront) Manahawkin, NJ 08050
Stafford NeighborhoodEstimated Value: $952,264 - $1,479,000
5
Beds
3
Baths
3,138
Sq Ft
$384/Sq Ft
Est. Value
About This Home
This home is located at 43 N Lakeshore Dr (Lakefront), Manahawkin, NJ 08050 and is currently estimated at $1,206,066, approximately $384 per square foot. 43 N Lakeshore Dr (Lakefront) is a home located in Ocean County with nearby schools including Oxycocus Elementary School, Ocean Acres Elementary School, and McKinley Avenue Elementary School.
Ownership History
Date
Name
Owned For
Owner Type
Purchase Details
Closed on
Nov 14, 2014
Sold by
Weber Charles R and Weber Phyllis M
Bought by
Schneider Scott
Current Estimated Value
Purchase Details
Closed on
Jun 1, 2006
Sold by
Alloway Richard P
Bought by
Weber Charles R and Weber Phyllis M
Home Financials for this Owner
Home Financials are based on the most recent Mortgage that was taken out on this home.
Original Mortgage
$500,000
Interest Rate
6.62%
Mortgage Type
Fannie Mae Freddie Mac
Purchase Details
Closed on
Jul 17, 1999
Sold by
Irvin Robert S and Irvin Barbara K
Bought by
Alloway Richard P and Alloway Barbara H
Home Financials for this Owner
Home Financials are based on the most recent Mortgage that was taken out on this home.
Original Mortgage
$41,200
Interest Rate
7.49%
Mortgage Type
Stand Alone Second
Create a Home Valuation Report for This Property
The Home Valuation Report is an in-depth analysis detailing your home's value as well as a comparison with similar homes in the area
Home Values in the Area
Average Home Value in this Area
Purchase History
| Date | Buyer | Sale Price | Title Company |
|---|---|---|---|
| Schneider Scott | $635,000 | University Title Ins Agency | |
| Weber Charles R | $700,000 | Transnation | |
| Alloway Richard P | $268,000 | -- |
Source: Public Records
Mortgage History
| Date | Status | Borrower | Loan Amount |
|---|---|---|---|
| Previous Owner | Weber Charles R | $500,000 | |
| Previous Owner | Alloway Richard P | $41,200 | |
| Previous Owner | Alloway Richard P | $200,000 |
Source: Public Records
Tax History Compared to Growth
Tax History
| Year | Tax Paid | Tax Assessment Tax Assessment Total Assessment is a certain percentage of the fair market value that is determined by local assessors to be the total taxable value of land and additions on the property. | Land | Improvement |
|---|---|---|---|---|
| 2025 | $14,719 | $592,800 | $290,800 | $302,000 |
| 2024 | $14,577 | $592,800 | $290,800 | $302,000 |
| 2023 | $13,955 | $592,800 | $290,800 | $302,000 |
| 2022 | $13,955 | $592,800 | $290,800 | $302,000 |
| 2021 | $13,765 | $592,800 | $290,800 | $302,000 |
| 2020 | $13,783 | $592,800 | $290,800 | $302,000 |
| 2019 | $13,587 | $592,800 | $290,800 | $302,000 |
| 2018 | $13,504 | $592,800 | $290,800 | $302,000 |
| 2017 | $13,342 | $567,000 | $290,800 | $276,200 |
| 2016 | $13,205 | $567,000 | $290,800 | $276,200 |
| 2015 | $12,740 | $567,000 | $290,800 | $276,200 |
| 2014 | $11,775 | $517,600 | $290,800 | $226,800 |
Source: Public Records
Map
Nearby Homes
- 520 Cedar Run Ln
- 25 N Union St
- 128 Rowan Ct
- 151 Littleworth Rd
- 155 Littleworth Rd
- 159 Littleworth Rd
- 223 Hilliard Blvd
- 247 Hilliard Blvd
- 557 Mermaid Dr
- 36 Fort Lee Dr
- 6 Hillsdale Ct
- 75 Perry Ln
- 84 Jennings Rd
- 40 Pine Grove Ave
- 400 S Main St
- 384 Hilliard Blvd
- 0 Pfeiffer Avenue W S
- 15 Cedar Hill Dr
- 18 Maple Tree Ct
- 5 Pine Cone Ln
- 43 N Lakeshore Dr
- 49 N Lakeshore Dr
- 44 N Lakeshore Dr
- 40 N Lakeshore Dr
- 55 N Lakeshore Dr
- 52 N Lakeshore Dr
- 36 N Lakeshore Dr
- 24 Lafayette Dr
- 152 Lehigh Ave
- 59 N Lakeshore Dr
- 56 N Lakeshore Dr
- 28 Lafayette Dr
- 156 Lehigh Ave
- 33 Lafayette Dr
- 22 N Lakeshore Dr
- 32 Lafayette Dr
- 60 N Lakeshore Dr
- 69 N Lakeshore Dr
- 164 Lehigh Ave
- 151 Lehigh Ave