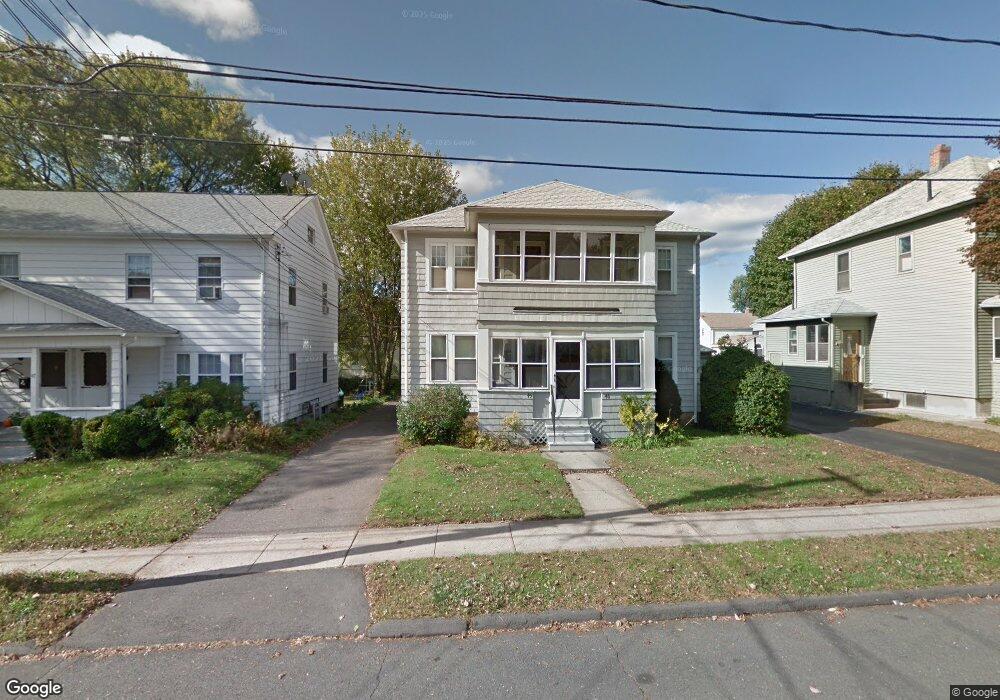
43 Nesbit Ave West Hartford, CT 06119
Estimated Value: $408,000 - $475,000
4
Beds
2
Baths
1,920
Sq Ft
$231/Sq Ft
Est. Value
About This Home
This home is located at 43 Nesbit Ave, West Hartford, CT 06119 and is currently estimated at $443,183, approximately $230 per square foot. 43 Nesbit Ave is a home located in Hartford County with nearby schools including Smith School, King Philip Middle School, and Hall High School.
Ownership History
Date
Name
Owned For
Owner Type
Purchase Details
Closed on
Aug 30, 2001
Sold by
Derubertis Alexis R
Bought by
Orourke Brian D
Current Estimated Value
Home Financials for this Owner
Home Financials are based on the most recent Mortgage that was taken out on this home.
Original Mortgage
$125,600
Interest Rate
7.06%
Purchase Details
Closed on
Apr 27, 2001
Sold by
Peoples Bank
Bought by
Derubertis Alexis R
Create a Home Valuation Report for This Property
The Home Valuation Report is an in-depth analysis detailing your home's value as well as a comparison with similar homes in the area
Home Values in the Area
Average Home Value in this Area
Purchase History
| Date | Buyer | Sale Price | Title Company |
|---|---|---|---|
| Orourke Brian D | $157,000 | -- | |
| Derubertis Alexis R | $110,000 | -- |
Source: Public Records
Mortgage History
| Date | Status | Borrower | Loan Amount |
|---|---|---|---|
| Open | Derubertis Alexis R | $126,000 | |
| Closed | Derubertis Alexis R | $136,000 | |
| Closed | Derubertis Alexis R | $125,600 | |
| Closed | Derubertis Alexis R | $15,700 |
Source: Public Records
Tax History Compared to Growth
Tax History
| Year | Tax Paid | Tax Assessment Tax Assessment Total Assessment is a certain percentage of the fair market value that is determined by local assessors to be the total taxable value of land and additions on the property. | Land | Improvement |
|---|---|---|---|---|
| 2025 | $9,090 | $203,000 | $68,320 | $134,680 |
| 2024 | $8,597 | $203,000 | $68,320 | $134,680 |
| 2023 | $8,307 | $203,000 | $68,320 | $134,680 |
| 2022 | $8,258 | $203,000 | $68,320 | $134,680 |
| 2021 | $7,967 | $187,810 | $62,090 | $125,720 |
| 2020 | $6,917 | $165,480 | $53,130 | $112,350 |
| 2019 | $6,917 | $165,480 | $53,130 | $112,350 |
| 2018 | $6,785 | $165,480 | $53,130 | $112,350 |
| 2017 | $6,791 | $165,480 | $53,130 | $112,350 |
| 2016 | $6,223 | $157,500 | $51,590 | $105,910 |
| 2015 | $6,034 | $157,500 | $51,590 | $105,910 |
| 2014 | $5,886 | $157,500 | $51,590 | $105,910 |
Source: Public Records
Map
Nearby Homes
- 89 Price Blvd
- 11 Crosby St
- 102 Oakwood Ave Unit B5
- 50 Acadia St
- 39 Fairlawn St
- 72 Saint Charles St
- 136 Kane St Unit B10
- 395 Park Rd
- 100 Kane St Unit D10
- 21 Warren Terrace
- 16 Lockwood Terrace
- 26 Saint Augustine St
- 69 Saint Augustine St
- 99 Caya Ave
- 61 Woodmere Rd
- 478 Prospect Ave
- 90-92 Rowe Ave
- 101 Englewood Ave
- 518 Prospect Ave
- 101 Madison Ave