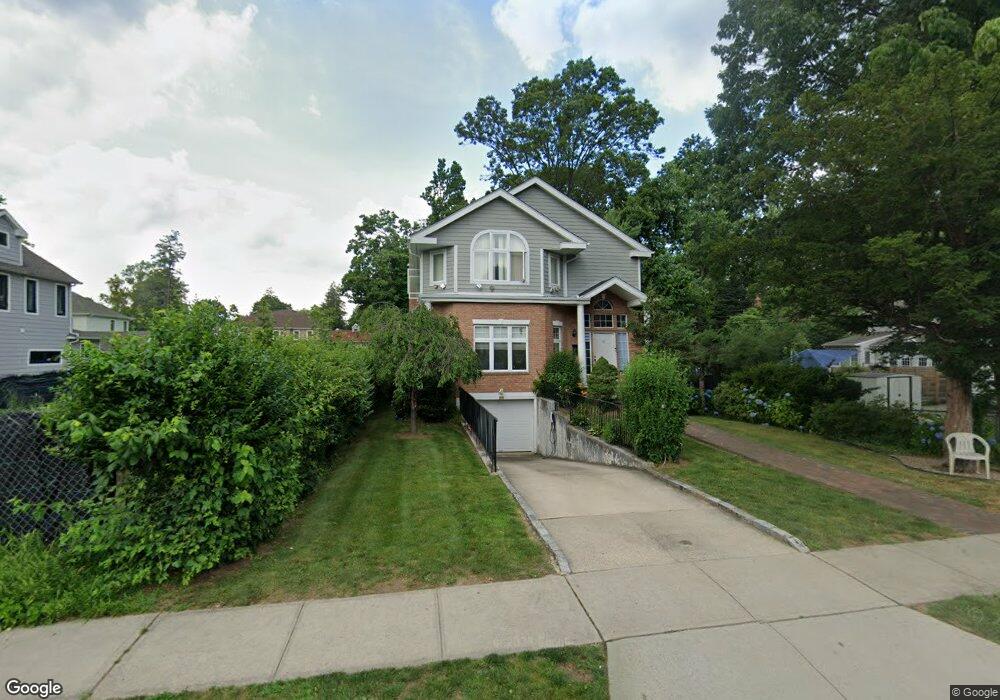
43 North Rd Great Neck, NY 11024
Estimated Value: $1,782,094 - $2,002,000
--
Bed
4
Baths
2,912
Sq Ft
$650/Sq Ft
Est. Value
About This Home
This home is located at 43 North Rd, Great Neck, NY 11024 and is currently estimated at $1,892,047, approximately $649 per square foot. 43 North Rd is a home located in Nassau County with nearby schools including John F Kennedy School, Richard S. Sherman - Great Neck North Middle School, and John L. Miller Great Neck North High School.
Ownership History
Date
Name
Owned For
Owner Type
Purchase Details
Closed on
Nov 30, 2012
Sold by
Kordevani Nassimi Rosalinda Ester
Bought by
Kordevani Nassimi Rosalinda Ester and Nassimi Raffaele
Current Estimated Value
Purchase Details
Closed on
Aug 15, 1997
Sold by
Habitat Developers Inc
Bought by
Nassimi Rosalinda Ester Kordeu
Purchase Details
Closed on
Jun 25, 1996
Sold by
Pritchett Frederick and Pritchett Marie Est
Bought by
Habitat Developers Corp
Create a Home Valuation Report for This Property
The Home Valuation Report is an in-depth analysis detailing your home's value as well as a comparison with similar homes in the area
Home Values in the Area
Average Home Value in this Area
Purchase History
| Date | Buyer | Sale Price | Title Company |
|---|---|---|---|
| Kordevani Nassimi Rosalinda Ester | -- | -- | |
| Nassimi Rosalinda Ester Kordeu | $480,000 | -- | |
| -- | -- | -- | |
| Habitat Developers Corp | $236,000 | -- |
Source: Public Records
Tax History Compared to Growth
Tax History
| Year | Tax Paid | Tax Assessment Tax Assessment Total Assessment is a certain percentage of the fair market value that is determined by local assessors to be the total taxable value of land and additions on the property. | Land | Improvement |
|---|---|---|---|---|
| 2025 | $19,700 | $1,259 | $507 | $752 |
| 2024 | $3,177 | $1,259 | $507 | $752 |
| 2023 | $14,717 | $1,215 | $489 | $726 |
| 2022 | $14,717 | $1,259 | $507 | $752 |
| 2021 | $14,055 | $1,300 | $467 | $833 |
| 2020 | $13,465 | $1,540 | $1,238 | $302 |
| 2019 | $14,012 | $1,650 | $1,243 | $407 |
| 2018 | $14,070 | $1,760 | $0 | $0 |
| 2017 | $11,311 | $1,870 | $1,252 | $618 |
| 2016 | $14,570 | $1,980 | $1,193 | $787 |
| 2015 | $3,591 | $2,090 | $1,260 | $830 |
| 2014 | $3,591 | $2,090 | $1,260 | $830 |
| 2013 | $3,607 | $2,200 | $1,326 | $874 |
Source: Public Records
Map
Nearby Homes