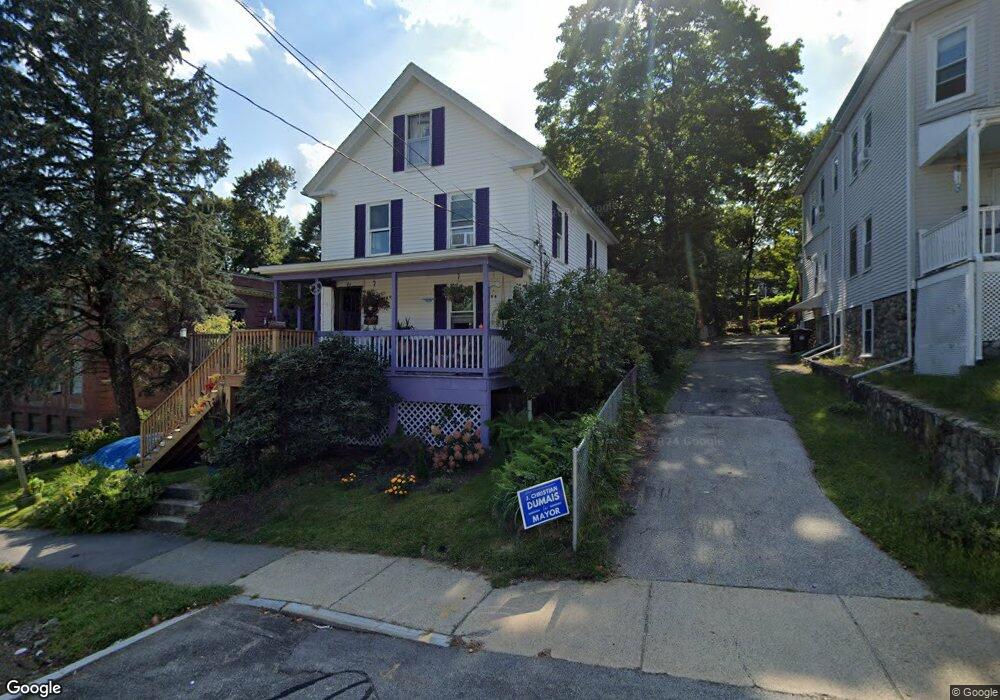
43 Orchard St Marlborough, MA 01752
Estimated Value: $488,000 - $542,000
3
Beds
2
Baths
1,712
Sq Ft
$307/Sq Ft
Est. Value
About This Home
This home is located at 43 Orchard St, Marlborough, MA 01752 and is currently estimated at $526,150, approximately $307 per square foot. 43 Orchard St is a home located in Middlesex County with nearby schools including Marlborough High School, Advanced Math & Science Academy, and New Covenant Christian School.
Ownership History
Date
Name
Owned For
Owner Type
Purchase Details
Closed on
Mar 17, 1997
Sold by
Works Richard E and Rosenquist Frances L
Bought by
Brace Eric M and Brace Nancy J
Current Estimated Value
Home Financials for this Owner
Home Financials are based on the most recent Mortgage that was taken out on this home.
Original Mortgage
$121,575
Outstanding Balance
$14,808
Interest Rate
7.79%
Mortgage Type
Purchase Money Mortgage
Estimated Equity
$511,342
Create a Home Valuation Report for This Property
The Home Valuation Report is an in-depth analysis detailing your home's value as well as a comparison with similar homes in the area
Home Values in the Area
Average Home Value in this Area
Purchase History
| Date | Buyer | Sale Price | Title Company |
|---|---|---|---|
| Brace Eric M | $122,900 | -- |
Source: Public Records
Mortgage History
| Date | Status | Borrower | Loan Amount |
|---|---|---|---|
| Open | Brace Eric M | $121,575 |
Source: Public Records
Tax History Compared to Growth
Tax History
| Year | Tax Paid | Tax Assessment Tax Assessment Total Assessment is a certain percentage of the fair market value that is determined by local assessors to be the total taxable value of land and additions on the property. | Land | Improvement |
|---|---|---|---|---|
| 2025 | $4,379 | $444,100 | $204,700 | $239,400 |
| 2024 | $4,251 | $415,100 | $186,100 | $229,000 |
| 2023 | $4,473 | $387,600 | $147,200 | $240,400 |
| 2022 | $4,423 | $337,100 | $140,200 | $196,900 |
| 2021 | $0 | $305,700 | $114,300 | $191,400 |
| 2020 | $4,173 | $294,300 | $111,300 | $183,000 |
| 2019 | $4,070 | $289,300 | $109,100 | $180,200 |
| 2018 | $0 | $248,400 | $87,000 | $161,400 |
| 2017 | $3,449 | $225,100 | $86,500 | $138,600 |
| 2016 | $3,419 | $222,900 | $86,500 | $136,400 |
| 2015 | $3,410 | $216,400 | $88,800 | $127,600 |
Source: Public Records
Map
Nearby Homes
- 32 Water St
- 63 W Main St
- 11 Paris St
- 30 Broad St Unit 104
- 76 Broad St
- 8 Saint Mary's Way Unit 8
- 175 Main St
- 272 Lincoln St Unit 102
- 272 Lincoln St Unit 101
- 272 Lincoln St Unit 203
- 156 Chestnut St
- 57 Neil St
- 73 Howland St
- 86 Rice St
- 27 Jefferson St
- 27 Jefferson St Unit 204
- 52 Norwood St
- 38 Gleason Street Extension
- 118 Elm St
- 30A Winter Ave