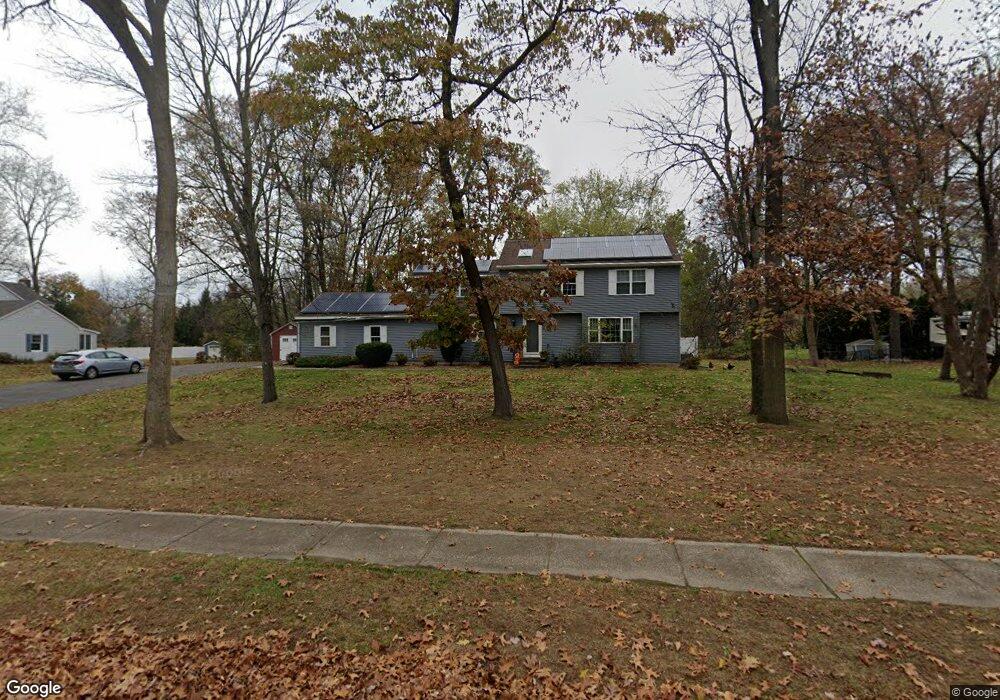
43 Oxbow Ln South Windsor, CT 06074
Estimated Value: $604,000 - $646,000
4
Beds
3
Baths
2,440
Sq Ft
$253/Sq Ft
Est. Value
About This Home
This home is located at 43 Oxbow Ln, South Windsor, CT 06074 and is currently estimated at $616,953, approximately $252 per square foot. 43 Oxbow Ln is a home located in Hartford County with nearby schools including Timothy Edwards School and South Windsor High School.
Ownership History
Date
Name
Owned For
Owner Type
Purchase Details
Closed on
Jun 2, 2010
Sold by
Morin Gerald and Morin Lynn
Bought by
Haswell Peter and Haswell Laila
Current Estimated Value
Home Financials for this Owner
Home Financials are based on the most recent Mortgage that was taken out on this home.
Original Mortgage
$264,000
Outstanding Balance
$177,554
Interest Rate
5.12%
Estimated Equity
$439,399
Create a Home Valuation Report for This Property
The Home Valuation Report is an in-depth analysis detailing your home's value as well as a comparison with similar homes in the area
Home Values in the Area
Average Home Value in this Area
Purchase History
| Date | Buyer | Sale Price | Title Company |
|---|---|---|---|
| Haswell Peter | $330,000 | -- |
Source: Public Records
Mortgage History
| Date | Status | Borrower | Loan Amount |
|---|---|---|---|
| Open | Haswell Peter | $264,000 |
Source: Public Records
Tax History Compared to Growth
Tax History
| Year | Tax Paid | Tax Assessment Tax Assessment Total Assessment is a certain percentage of the fair market value that is determined by local assessors to be the total taxable value of land and additions on the property. | Land | Improvement |
|---|---|---|---|---|
| 2025 | $12,157 | $341,400 | $130,200 | $211,200 |
| 2024 | $11,765 | $341,400 | $130,200 | $211,200 |
| 2023 | $11,314 | $341,400 | $130,200 | $211,200 |
| 2022 | $10,534 | $271,700 | $130,200 | $141,500 |
| 2021 | $10,287 | $271,700 | $130,200 | $141,500 |
| 2020 | $10,182 | $268,800 | $130,200 | $138,600 |
| 2019 | $10,349 | $268,800 | $130,200 | $138,600 |
| 2018 | $10,126 | $268,800 | $130,200 | $138,600 |
| 2017 | $10,651 | $279,700 | $146,500 | $133,200 |
| 2016 | $10,444 | $279,700 | $146,500 | $133,200 |
| 2015 | $10,220 | $279,700 | $146,500 | $133,200 |
| 2014 | $9,932 | $279,700 | $146,500 | $133,200 |
Source: Public Records
Map
Nearby Homes
- 1638 Main St
- 372 Scantic Rd Unit 8
- 1063 Main St
- 1047 Main St
- 29 W River Rd
- 34 W River Rd
- 27 W River Rd
- 26 Cathy (Lot 13) Ln
- 24 Cathy (Lot 14) Ln
- 20 Cathy (Lot 16) Ln
- 22 Cathy (Lot 15) Ln
- 18 Cathy (Lot 17) Ln
- 43 W River Rd
- 23 Cathy (Lot 21) Ln
- 21 Ln
- 19 Cathy (Lot 19) Ln
- 17 Cathy (Lot 18) Ln
- 668 Sullivan Ave
- 951 Main St
- 35 Dower Rd