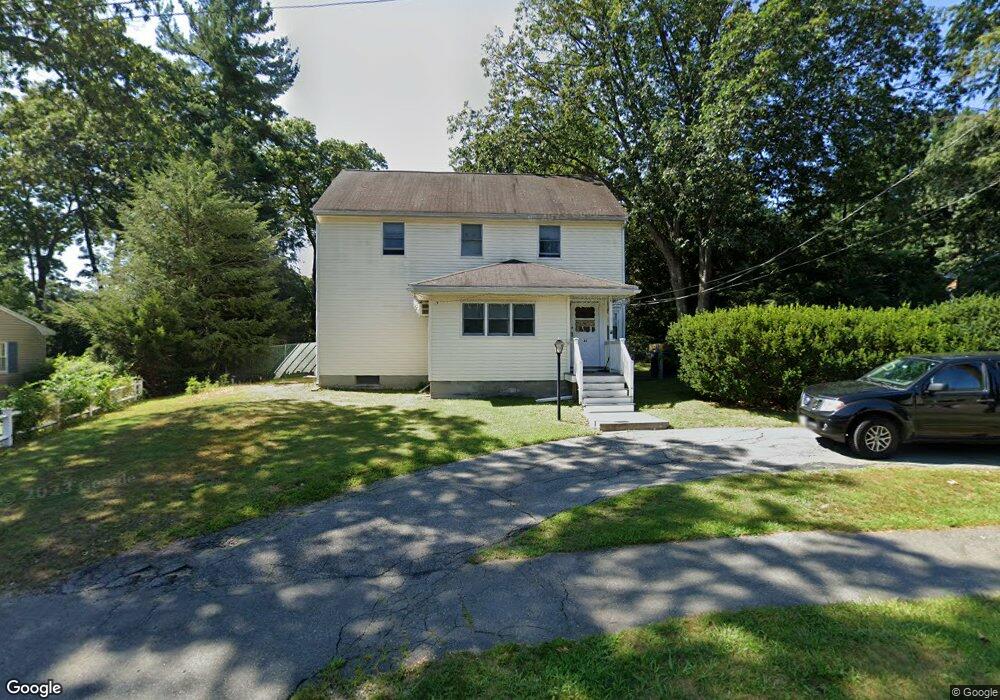
43 Park St Wilmington, MA 01887
Estimated Value: $738,000 - $796,000
3
Beds
2
Baths
2,040
Sq Ft
$376/Sq Ft
Est. Value
About This Home
This home is located at 43 Park St, Wilmington, MA 01887 and is currently estimated at $766,922, approximately $375 per square foot. 43 Park St is a home located in Middlesex County with nearby schools including Wilmington Middle School, Wilmington High School, and N Reading Knowledge Beginnings.
Ownership History
Date
Name
Owned For
Owner Type
Purchase Details
Closed on
Oct 31, 1997
Sold by
Hayes John Est
Bought by
Burke Robert L
Current Estimated Value
Home Financials for this Owner
Home Financials are based on the most recent Mortgage that was taken out on this home.
Original Mortgage
$118,000
Interest Rate
7.31%
Mortgage Type
Purchase Money Mortgage
Create a Home Valuation Report for This Property
The Home Valuation Report is an in-depth analysis detailing your home's value as well as a comparison with similar homes in the area
Home Values in the Area
Average Home Value in this Area
Purchase History
| Date | Buyer | Sale Price | Title Company |
|---|---|---|---|
| Burke Robert L | $164,000 | -- |
Source: Public Records
Mortgage History
| Date | Status | Borrower | Loan Amount |
|---|---|---|---|
| Open | Burke Robert L | $115,000 | |
| Closed | Burke Robert L | $167,000 | |
| Closed | Burke Robert L | $118,000 |
Source: Public Records
Tax History Compared to Growth
Tax History
| Year | Tax Paid | Tax Assessment Tax Assessment Total Assessment is a certain percentage of the fair market value that is determined by local assessors to be the total taxable value of land and additions on the property. | Land | Improvement |
|---|---|---|---|---|
| 2025 | $7,405 | $646,700 | $276,000 | $370,700 |
| 2024 | $7,173 | $627,600 | $276,000 | $351,600 |
| 2023 | $6,851 | $573,800 | $250,900 | $322,900 |
| 2022 | $6,888 | $528,600 | $209,100 | $319,500 |
| 2021 | $6,625 | $478,700 | $190,000 | $288,700 |
| 2020 | $6,626 | $487,900 | $190,000 | $297,900 |
| 2019 | $6,416 | $466,600 | $180,900 | $285,700 |
| 2018 | $6,185 | $429,200 | $172,400 | $256,800 |
| 2017 | $5,585 | $386,500 | $169,400 | $217,100 |
| 2016 | $5,404 | $369,400 | $161,400 | $208,000 |
| 2015 | $5,370 | $373,700 | $161,400 | $212,300 |
| 2014 | $5,051 | $354,700 | $153,700 | $201,000 |
Source: Public Records
Map
Nearby Homes
- 42 High St
- 9 Marie Dr
- 401 Middlesex Ave
- 7 W Village Dr
- 5 Flynn Way
- 11 Cedarcrest Rd
- 260 Martins Landing Unit 103
- 240 Martins Landing Unit 409
- 240 Martins Landing Unit 201
- 260 Martins Landing Unit 508
- 3 Catherine Ave
- Lincoln Plan at Martins Landing
- Ivywood Plan at Martins Landing
- Hayden Plan at Martins Landing
- Franklin Plan at Martins Landing
- Claremont Plan at Martins Landing
- Magnolia Plan at Martins Landing
- Jameson Plan at Martins Landing
- 300 Martins Landing Unit 107
- 250 Martins Landing Unit 213