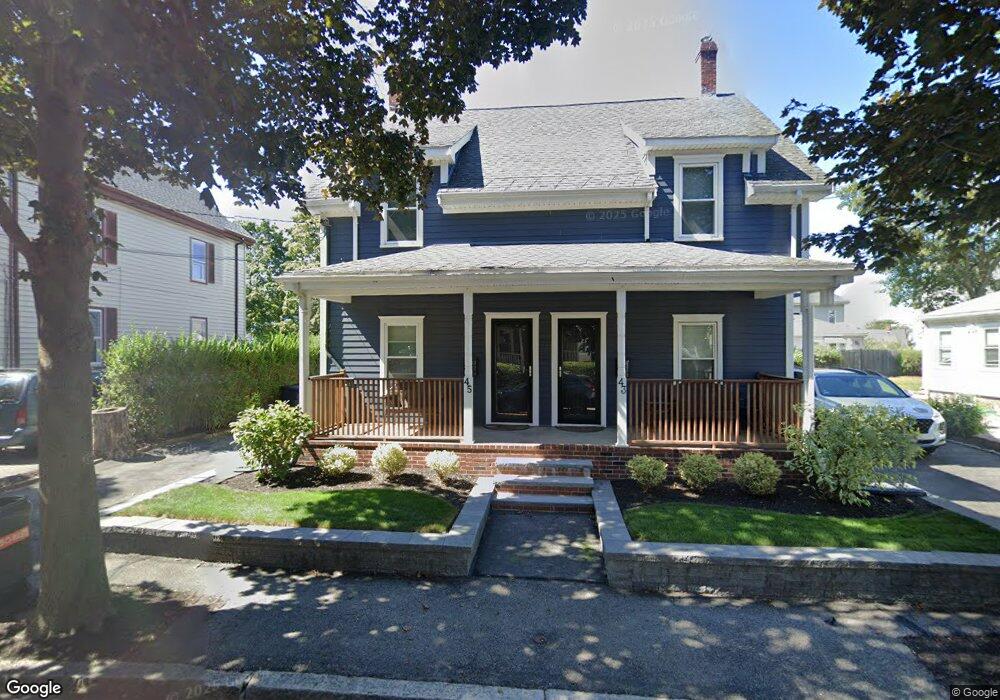
43 Payne St Quincy, MA 02169
South Quincy NeighborhoodEstimated Value: $845,255 - $902,000
4
Beds
2
Baths
2,072
Sq Ft
$421/Sq Ft
Est. Value
About This Home
This home is located at 43 Payne St, Quincy, MA 02169 and is currently estimated at $871,314, approximately $420 per square foot. 43 Payne St is a home located in Norfolk County with nearby schools including Lincoln-Hancock Community School, South West Middle School, and Quincy High School.
Ownership History
Date
Name
Owned For
Owner Type
Purchase Details
Closed on
Mar 1, 2004
Sold by
Caruso Doris M
Bought by
White Anthony
Current Estimated Value
Home Financials for this Owner
Home Financials are based on the most recent Mortgage that was taken out on this home.
Original Mortgage
$399,000
Outstanding Balance
$186,214
Interest Rate
5.65%
Mortgage Type
Purchase Money Mortgage
Estimated Equity
$685,100
Create a Home Valuation Report for This Property
The Home Valuation Report is an in-depth analysis detailing your home's value as well as a comparison with similar homes in the area
Home Values in the Area
Average Home Value in this Area
Purchase History
| Date | Buyer | Sale Price | Title Company |
|---|---|---|---|
| White Anthony | $420,000 | -- |
Source: Public Records
Mortgage History
| Date | Status | Borrower | Loan Amount |
|---|---|---|---|
| Open | White Anthony | $399,000 |
Source: Public Records
Tax History Compared to Growth
Tax History
| Year | Tax Paid | Tax Assessment Tax Assessment Total Assessment is a certain percentage of the fair market value that is determined by local assessors to be the total taxable value of land and additions on the property. | Land | Improvement |
|---|---|---|---|---|
| 2025 | $8,823 | $765,200 | $288,400 | $476,800 |
| 2024 | $8,317 | $738,000 | $274,600 | $463,400 |
| 2023 | $7,976 | $716,600 | $249,700 | $466,900 |
| 2022 | $7,833 | $653,800 | $208,000 | $445,800 |
| 2021 | $7,409 | $610,300 | $208,000 | $402,300 |
| 2020 | $7,490 | $602,600 | $208,000 | $394,600 |
| 2019 | $6,630 | $528,300 | $196,300 | $332,000 |
| 2018 | $6,614 | $495,800 | $181,800 | $314,000 |
| 2017 | $6,681 | $471,500 | $173,100 | $298,400 |
| 2016 | $5,924 | $412,500 | $150,500 | $262,000 |
| 2015 | $5,812 | $398,100 | $150,500 | $247,600 |
| 2014 | $5,020 | $337,800 | $150,500 | $187,300 |
Source: Public Records
Map
Nearby Homes
- 5 Pearl St
- 166 Phipps St
- 83 Madison Ave
- 155 Kendrick Ave Unit T7
- 8 Jackson St Unit B2
- 57 Summer St
- 72 Federal Ave
- 33 Brook Rd
- 165 Granite St
- 94 Brook Rd Unit 3
- 18 Cliveden St Unit 201W
- 2 Cliveden St Unit 601E
- 34 South St Unit 202
- 293 Whitwell St
- 73 Scotch Pond Place
- 36 Bigelow St
- 215 Thomas Burgin Pkwy Unit 35
- 5 Main St
- 123 Elm St Unit D-8
- 10 Hughes St