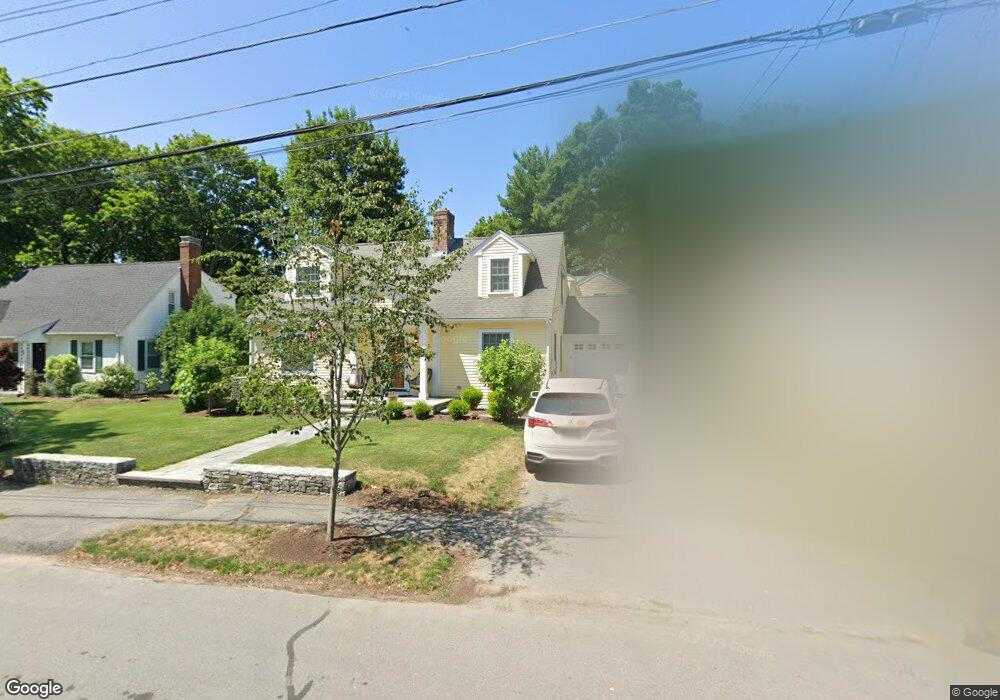
43 Philbrick Rd Newton Center, MA 02459
Thompsonville NeighborhoodEstimated Value: $1,602,000 - $1,846,000
3
Beds
3
Baths
2,750
Sq Ft
$635/Sq Ft
Est. Value
About This Home
This home is located at 43 Philbrick Rd, Newton Center, MA 02459 and is currently estimated at $1,745,933, approximately $634 per square foot. 43 Philbrick Rd is a home located in Middlesex County with nearby schools including Bowen School, Countryside Elementary School, and Charles E Brown Middle School.
Ownership History
Date
Name
Owned For
Owner Type
Purchase Details
Closed on
Oct 27, 1995
Sold by
Senerchia Jay V
Bought by
Leonard Elizabeth C
Current Estimated Value
Home Financials for this Owner
Home Financials are based on the most recent Mortgage that was taken out on this home.
Original Mortgage
$203,000
Interest Rate
7.6%
Mortgage Type
Purchase Money Mortgage
Create a Home Valuation Report for This Property
The Home Valuation Report is an in-depth analysis detailing your home's value as well as a comparison with similar homes in the area
Home Values in the Area
Average Home Value in this Area
Purchase History
| Date | Buyer | Sale Price | Title Company |
|---|---|---|---|
| Leonard Elizabeth C | $302,000 | -- |
Source: Public Records
Mortgage History
| Date | Status | Borrower | Loan Amount |
|---|---|---|---|
| Open | Leonard Elizabeth C | $377,100 | |
| Closed | Leonard Elizabeth C | $378,000 | |
| Closed | Leonard Elizabeth C | $204,500 | |
| Closed | Leonard Elizabeth C | $203,000 |
Source: Public Records
Tax History Compared to Growth
Tax History
| Year | Tax Paid | Tax Assessment Tax Assessment Total Assessment is a certain percentage of the fair market value that is determined by local assessors to be the total taxable value of land and additions on the property. | Land | Improvement |
|---|---|---|---|---|
| 2025 | $14,120 | $1,440,800 | $886,700 | $554,100 |
| 2024 | $13,652 | $1,398,800 | $860,900 | $537,900 |
| 2023 | $12,941 | $1,271,200 | $654,700 | $616,500 |
| 2022 | $12,382 | $1,177,000 | $606,200 | $570,800 |
| 2021 | $11,948 | $1,110,400 | $571,900 | $538,500 |
| 2020 | $11,593 | $1,110,400 | $571,900 | $538,500 |
| 2019 | $11,266 | $1,078,100 | $555,200 | $522,900 |
| 2018 | $10,817 | $999,700 | $504,000 | $495,700 |
| 2017 | $10,473 | $941,800 | $475,500 | $466,300 |
| 2016 | $10,017 | $880,200 | $444,400 | $435,800 |
| 2015 | $9,550 | $822,600 | $415,300 | $407,300 |
Source: Public Records
Map
Nearby Homes
- 21 Philbrick Rd
- 628 Boylston St
- 19 Selwyn Rd
- 35 Haynes Rd
- 625 Boylston St
- 42 Sunhill Ln
- 671 Boylston St
- 45 Brandeis Rd
- 5 Halcyon Rd
- 125 Oakdale Rd
- 85 Dudley Rd
- 42 Bow Rd
- 250 Woodcliff Rd
- 1308 Walnut St
- 1292 Walnut St
- 36 Cannon St
- 136 Dudley Rd
- 1597 Centre St Unit 1597
- 1597 Centre St
- 1623-1625 Centre St