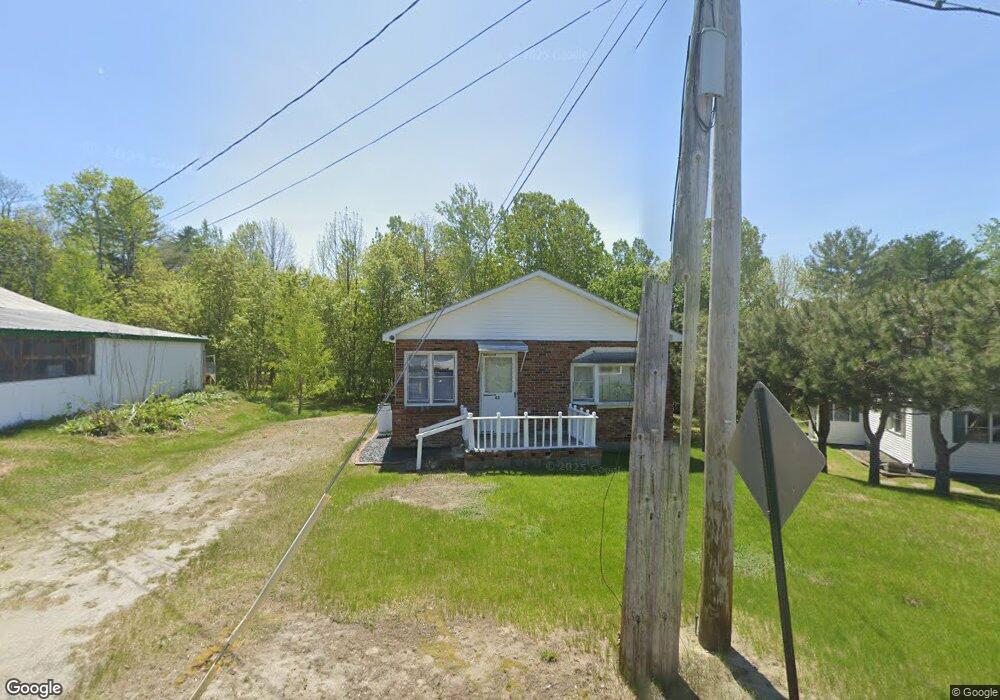
43 Pooler Skowhegan, ME 04976
Estimated Value: $108,000 - $152,846
1
Bed
1
Bath
864
Sq Ft
$162/Sq Ft
Est. Value
About This Home
This home is located at 43 Pooler, Skowhegan, ME 04976 and is currently estimated at $139,962, approximately $161 per square foot. 43 Pooler is a home located in Somerset County with nearby schools including Creative Children's Academy, Overman Academy, and Faith Baptist Christian School.
Ownership History
Date
Name
Owned For
Owner Type
Purchase Details
Closed on
Mar 28, 2025
Sold by
Andrew P Dipalma Irt and Dipalma
Bought by
Poland Kristi
Current Estimated Value
Home Financials for this Owner
Home Financials are based on the most recent Mortgage that was taken out on this home.
Original Mortgage
$137,464
Outstanding Balance
$136,879
Interest Rate
6.87%
Mortgage Type
FHA
Estimated Equity
$3,083
Purchase Details
Closed on
May 14, 2013
Sold by
Cariani Delia M and Dipalma Andrew P
Bought by
Andrew P Dipalma Irt and Dipalma
Create a Home Valuation Report for This Property
The Home Valuation Report is an in-depth analysis detailing your home's value as well as a comparison with similar homes in the area
Home Values in the Area
Average Home Value in this Area
Purchase History
| Date | Buyer | Sale Price | Title Company |
|---|---|---|---|
| Poland Kristi | -- | None Available | |
| Poland Kristi | -- | None Available | |
| Andrew P Dipalma Irt | -- | -- | |
| Andrew P Dipalma Irt | -- | -- |
Source: Public Records
Mortgage History
| Date | Status | Borrower | Loan Amount |
|---|---|---|---|
| Open | Poland Kristi | $137,464 | |
| Closed | Poland Kristi | $137,464 |
Source: Public Records
Tax History Compared to Growth
Tax History
| Year | Tax Paid | Tax Assessment Tax Assessment Total Assessment is a certain percentage of the fair market value that is determined by local assessors to be the total taxable value of land and additions on the property. | Land | Improvement |
|---|---|---|---|---|
| 2024 | $1,643 | $90,900 | $16,600 | $74,300 |
| 2023 | $1,673 | $94,400 | $20,100 | $74,300 |
| 2022 | $1,339 | $76,600 | $14,100 | $62,500 |
| 2021 | $1,255 | $68,400 | $14,100 | $54,300 |
| 2020 | $1,138 | $63,200 | $14,100 | $49,100 |
| 2019 | $1,090 | $63,200 | $14,100 | $49,100 |
| 2018 | $1,150 | $63,200 | $14,100 | $49,100 |
| 2017 | $1,264 | $63,200 | $14,100 | $49,100 |
| 2016 | $1,097 | $57,600 | $16,600 | $41,000 |
| 2015 | $1,054 | $57,600 | $16,600 | $41,000 |
| 2014 | $988 | $57,600 | $16,600 | $41,000 |
| 2013 | $945 | $57,600 | $16,600 | $41,000 |
Source: Public Records
Map
Nearby Homes