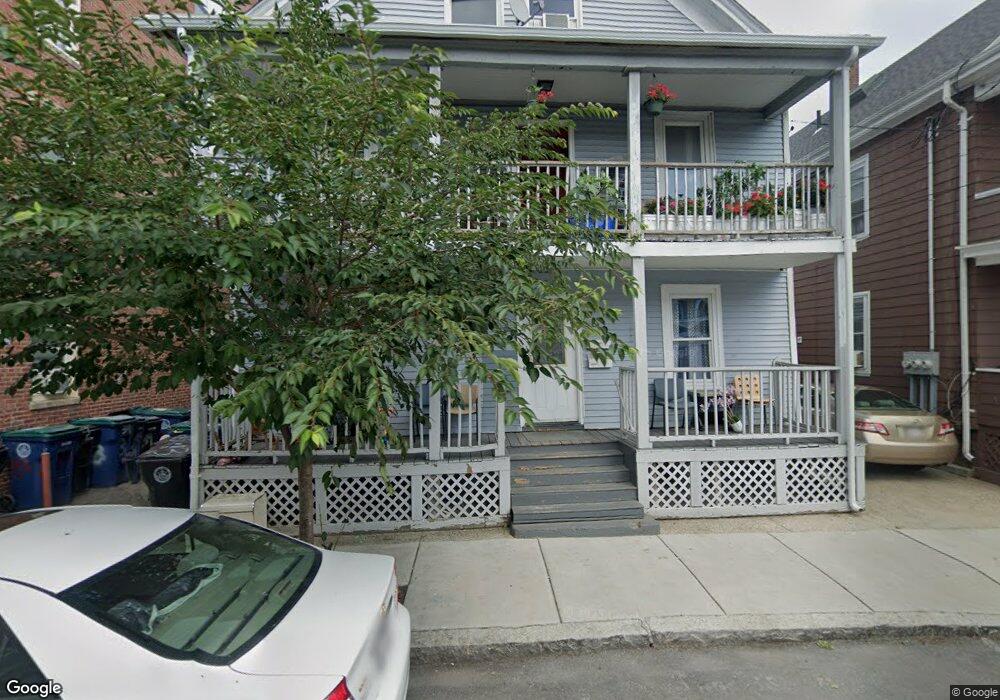
43 Prince St Unit 2 Salem, MA 01970
The Point NeighborhoodEstimated Value: $582,780 - $900,000
8
Beds
3
Baths
2,133
Sq Ft
$324/Sq Ft
Est. Value
About This Home
This home is located at 43 Prince St Unit 2, Salem, MA 01970 and is currently estimated at $690,195, approximately $323 per square foot. 43 Prince St Unit 2 is a home located in Essex County with nearby schools including Saltonstall School, Carlton Elementary School, and Bates Elementary School.
Ownership History
Date
Name
Owned For
Owner Type
Purchase Details
Closed on
Apr 24, 2013
Sold by
Toribio Juan J and Toribio Juana I
Bought by
Doaba Props Llc
Current Estimated Value
Purchase Details
Closed on
Dec 4, 2008
Sold by
Deutsche Bank Natl T C
Bought by
Toribio Juan J
Home Financials for this Owner
Home Financials are based on the most recent Mortgage that was taken out on this home.
Original Mortgage
$162,850
Interest Rate
6.11%
Mortgage Type
Purchase Money Mortgage
Purchase Details
Closed on
Mar 19, 2008
Sold by
Pichardo Milciades
Bought by
Deutsche Bank Natl T C
Purchase Details
Closed on
Mar 29, 2005
Sold by
Guerrero Elia
Bought by
Pichardo Milciades
Purchase Details
Closed on
Jan 28, 2003
Sold by
Baez Julio
Bought by
Guerrero Elia
Purchase Details
Closed on
Dec 1, 1998
Sold by
Lee Gerry G and Mckenna Patricia A
Bought by
Baez Julio
Create a Home Valuation Report for This Property
The Home Valuation Report is an in-depth analysis detailing your home's value as well as a comparison with similar homes in the area
Home Values in the Area
Average Home Value in this Area
Purchase History
| Date | Buyer | Sale Price | Title Company |
|---|---|---|---|
| Doaba Props Llc | $175,000 | -- | |
| Toribio Juan J | $164,999 | -- | |
| Deutsche Bank Natl T C | $255,000 | -- | |
| Pichardo Milciades | $377,000 | -- | |
| Guerrero Elia | $275,000 | -- | |
| Baez Julio | $55,000 | -- |
Source: Public Records
Mortgage History
| Date | Status | Borrower | Loan Amount |
|---|---|---|---|
| Previous Owner | Baez Julio | $163,400 | |
| Previous Owner | Baez Julio | $162,850 |
Source: Public Records
Tax History
| Year | Tax Paid | Tax Assessment Tax Assessment Total Assessment is a certain percentage of the fair market value that is determined by local assessors to be the total taxable value of land and additions on the property. | Land | Improvement |
|---|---|---|---|---|
| 2025 | $5,660 | $499,100 | $140,800 | $358,300 |
| 2024 | $5,500 | $473,300 | $140,800 | $332,500 |
| 2023 | $5,184 | $414,400 | $124,200 | $290,200 |
| 2022 | $5,365 | $404,900 | $115,900 | $289,000 |
| 2021 | $5,095 | $369,200 | $108,200 | $261,000 |
| 2020 | $4,777 | $330,600 | $79,800 | $250,800 |
| 2019 | $4,654 | $308,200 | $70,400 | $237,800 |
| 2018 | $4,339 | $282,100 | $70,400 | $211,700 |
| 2017 | $4,103 | $258,700 | $60,100 | $198,600 |
| 2016 | $4,054 | $258,700 | $60,100 | $198,600 |
| 2015 | $3,431 | $209,100 | $51,600 | $157,500 |
Source: Public Records
Map
Nearby Homes
- 3 Chase St
- 185 Lafayette St Unit 3
- 88 Congress St Unit 3
- 7 Fairfield St
- 59 Leach St Unit 2
- 13 Roslyn St Unit 2
- 9 Glover St Unit 1
- 86 Wharf St Unit 6
- 6R Hazel Terrace Unit 1
- 4 Willow Ave Unit 2
- 10 Hazel St Unit 2
- 225 Derby St Unit 503
- 22 Prescott St Unit 1
- 29 Ocean Ave Unit 4
- 10.5 Herbert St Unit 21
- 24 Norman St Unit 110
- 1 Shore Ave
- 7 Curtis St Unit 1
- 11 Church St Unit 203
- 11 Church St Unit 702
- 43 Prince St
- 36 Naumkeag St Unit 4
- 36 Naumkeag St Unit 3
- 36 Naumkeag St Unit 2
- 36 Naumkeag St Unit 1
- 45 Prince St
- 39 Prince St
- 38 Naumkeag St Unit 3-1
- 49 Prince St
- 40 Prince St
- 44 Prince St Unit 2
- 44 Prince St Unit 1
- 51 Prince St Unit 3
- 51 Prince St Unit 2
- 51 Prince St Unit 1
- 42 Prince St
- 38 Palmer St
- 46 Prince St
- 47 Leavitt St
- 38 Prince St
Your Personal Tour Guide
Ask me questions while you tour the home.