Estimated Value: $200,000 - $224,000
3
Beds
2
Baths
1,007
Sq Ft
$212/Sq Ft
Est. Value
About This Home
This home is located at 43 Prospect Path, Hiram, GA 30141 and is currently estimated at $213,208, approximately $211 per square foot. 43 Prospect Path is a home located in Paulding County with nearby schools including Hiram Elementary School, P. B. Ritch Middle School, and Hiram High School.
Ownership History
Date
Name
Owned For
Owner Type
Purchase Details
Closed on
Aug 27, 2018
Sold by
Crews Donna J
Bought by
Hochberg Ira
Current Estimated Value
Home Financials for this Owner
Home Financials are based on the most recent Mortgage that was taken out on this home.
Original Mortgage
$80,025
Outstanding Balance
$69,643
Interest Rate
4.5%
Mortgage Type
New Conventional
Estimated Equity
$143,565
Purchase Details
Closed on
Mar 13, 2002
Sold by
West Winds Dev Inc
Bought by
Crews Donna J
Home Financials for this Owner
Home Financials are based on the most recent Mortgage that was taken out on this home.
Original Mortgage
$8,565
Interest Rate
6.92%
Mortgage Type
New Conventional
Create a Home Valuation Report for This Property
The Home Valuation Report is an in-depth analysis detailing your home's value as well as a comparison with similar homes in the area
Home Values in the Area
Average Home Value in this Area
Purchase History
| Date | Buyer | Sale Price | Title Company |
|---|---|---|---|
| Hochberg Ira | $82,500 | -- | |
| Crews Donna J | -- | -- |
Source: Public Records
Mortgage History
| Date | Status | Borrower | Loan Amount |
|---|---|---|---|
| Open | Hochberg Ira | $80,025 | |
| Previous Owner | Crews Donna J | $8,565 |
Source: Public Records
Tax History Compared to Growth
Tax History
| Year | Tax Paid | Tax Assessment Tax Assessment Total Assessment is a certain percentage of the fair market value that is determined by local assessors to be the total taxable value of land and additions on the property. | Land | Improvement |
|---|---|---|---|---|
| 2024 | $1,790 | $75,184 | $12,000 | $63,184 |
| 2023 | $1,917 | $76,072 | $12,000 | $64,072 |
| 2022 | $1,622 | $64,084 | $12,000 | $52,084 |
| 2021 | $1,290 | $46,236 | $6,000 | $40,236 |
| 2020 | $1,257 | $44,160 | $6,000 | $38,160 |
| 2019 | $938 | $41,204 | $6,000 | $35,204 |
| 2018 | $878 | $29,148 | $4,000 | $25,148 |
| 2017 | $724 | $23,704 | $4,000 | $19,704 |
| 2016 | $711 | $23,520 | $4,000 | $19,520 |
| 2015 | $729 | $23,692 | $4,000 | $19,692 |
| 2014 | $500 | $15,852 | $4,000 | $11,852 |
| 2013 | -- | $11,360 | $4,000 | $7,360 |
Source: Public Records
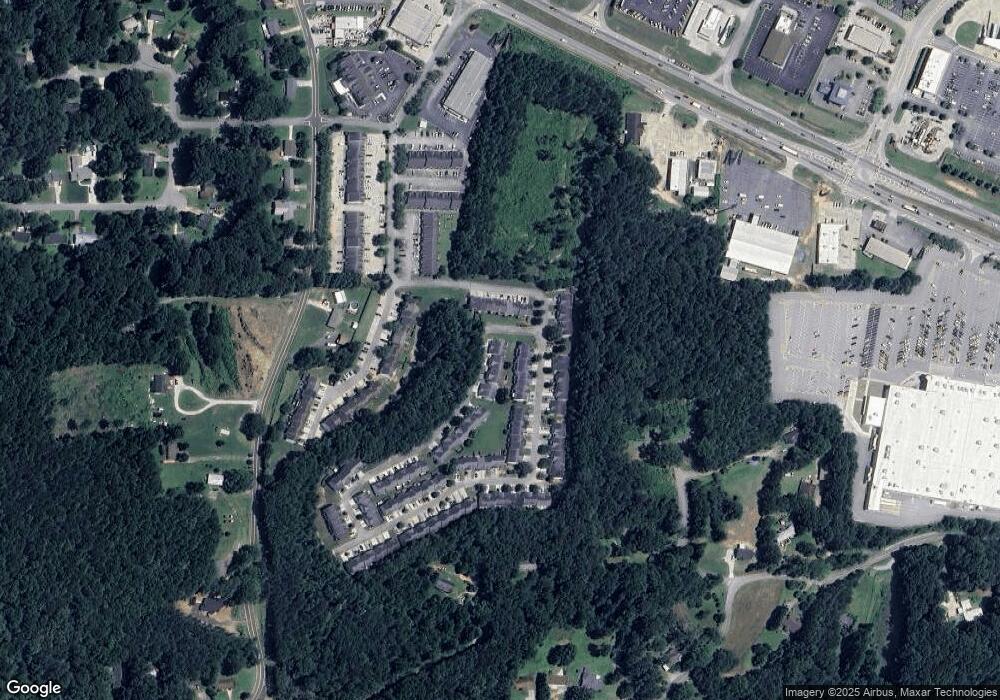
Map
Nearby Homes
- 209 Enterprise Path
- 194 Prospect Path
- 000 Us Highway 278
- 150 Hiram Terrace
- 98 Pace Dr
- 329 Hiram Douglasville Hwy
- 146 Rosemont Ct
- 263 Hiram Douglasville Hwy
- 00 Highland
- 491 Hiram Douglasville Hwy
- 295 Hiram Acworth Hwy
- 244 Rosedale Dr
- 585 Hiram Douglasville Hwy
- 0 Old Mill Rd Unit 7632177
- 0 Old Mill Rd Unit 10569938
- 304 Greystone Pkwy
- 386 Hill Crest Cir
- 536 Highland Falls Dr
- 1 Corley Cir
- 0 Highway 278 NE Unit 10338401
- 45 Prospect Path
- 45 Prospect Path Unit 45
- 51 Prospect Path
- 51 Prospect Path
- 122 Venture Path
- 122 Venture Path Unit 122
- 53 Prospect Path
- 126 Venture Path
- 66 Venture Path
- 132 Venture Path
- 132 Venture Path Unit 1506
- 132 Venture Path Unit 132
- 59 Prospect Path
- 70 Venture Path
- 70 Venture Path Unit 1
- 70 Venture Path Unit 70
- 74 Venture Path Unit 403
- 74 Venture Path
- 136 Venture Path
- 136 Venture Path Unit 136