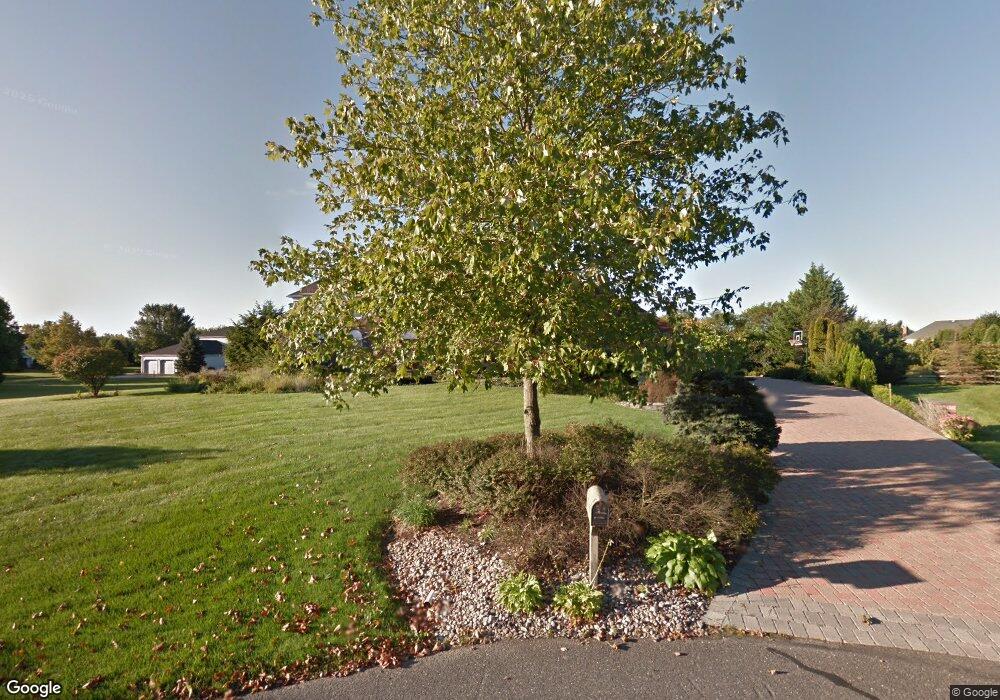
43 Providence Ct Princeton Junction, NJ 08550
Estimated Value: $1,382,950 - $1,555,000
--
Bed
--
Bath
3,754
Sq Ft
$383/Sq Ft
Est. Value
About This Home
This home is located at 43 Providence Ct, Princeton Junction, NJ 08550 and is currently estimated at $1,438,238, approximately $383 per square foot. 43 Providence Ct is a home located in Mercer County with nearby schools including Village Elementary School, Dutch Neck Elementary School, and Community Middle School.
Ownership History
Date
Name
Owned For
Owner Type
Purchase Details
Closed on
Feb 24, 1992
Sold by
Capadona Victor P and Capadona Debra L
Bought by
Pepper Mark D and Pepper Anne K
Current Estimated Value
Purchase Details
Closed on
Jun 10, 1990
Sold by
Seergy Michael J and Seergy Kathleen D
Bought by
Capadona Victor P and Capadona Debra L
Purchase Details
Closed on
Dec 21, 1988
Sold by
Princeton Oaks Inc
Bought by
Seegry Michael J and Seegry Kathleen D
Create a Home Valuation Report for This Property
The Home Valuation Report is an in-depth analysis detailing your home's value as well as a comparison with similar homes in the area
Home Values in the Area
Average Home Value in this Area
Purchase History
| Date | Buyer | Sale Price | Title Company |
|---|---|---|---|
| Pepper Mark D | $469,000 | -- | |
| Pepper Mark D | $469,000 | -- | |
| Capadona Victor P | $437,000 | -- | |
| Seegry Michael J | $426,600 | -- |
Source: Public Records
Tax History Compared to Growth
Tax History
| Year | Tax Paid | Tax Assessment Tax Assessment Total Assessment is a certain percentage of the fair market value that is determined by local assessors to be the total taxable value of land and additions on the property. | Land | Improvement |
|---|---|---|---|---|
| 2025 | $25,173 | $821,300 | $310,400 | $557,200 |
| 2024 | $24,122 | $821,300 | $310,400 | $557,200 |
| 2023 | $24,122 | $867,600 | $310,400 | $557,200 |
| 2022 | $23,653 | $821,300 | $0 | $0 |
| 2021 | $23,456 | $821,300 | $0 | $0 |
| 2020 | $23,029 | $821,300 | $0 | $0 |
| 2019 | $22,766 | $867,600 | $310,400 | $557,200 |
| 2018 | $22,553 | $867,600 | $310,400 | $557,200 |
| 2017 | $22,085 | $867,600 | $310,400 | $557,200 |
| 2016 | $21,608 | $821,300 | $310,400 | $510,900 |
| 2015 | $21,107 | $821,300 | $310,400 | $510,900 |
| 2014 | $20,861 | $821,300 | $310,400 | $510,900 |
Source: Public Records
Map
Nearby Homes
- 16 Spruce St
- 19 Shadow Dr
- 10 Manor Ridge Dr
- 5 Glengarry Way
- 75 Honeyflower Ln
- 22 Slayback Dr
- 26 Rainflower La
- 84 Rainflower La
- 44 Sapphire Dr
- 17 Grande Blvd
- 6 Grande Blvd
- 1784 Old Trenton Rd
- 18 Newport Dr
- 55 Rainflower Ln
- 32 W Kincaid Dr
- 302 Blanketflower Ln
- 6 Howell Ct
- 42 Holtz Way
- 36 Holtz Way
- 42 Nassau Place