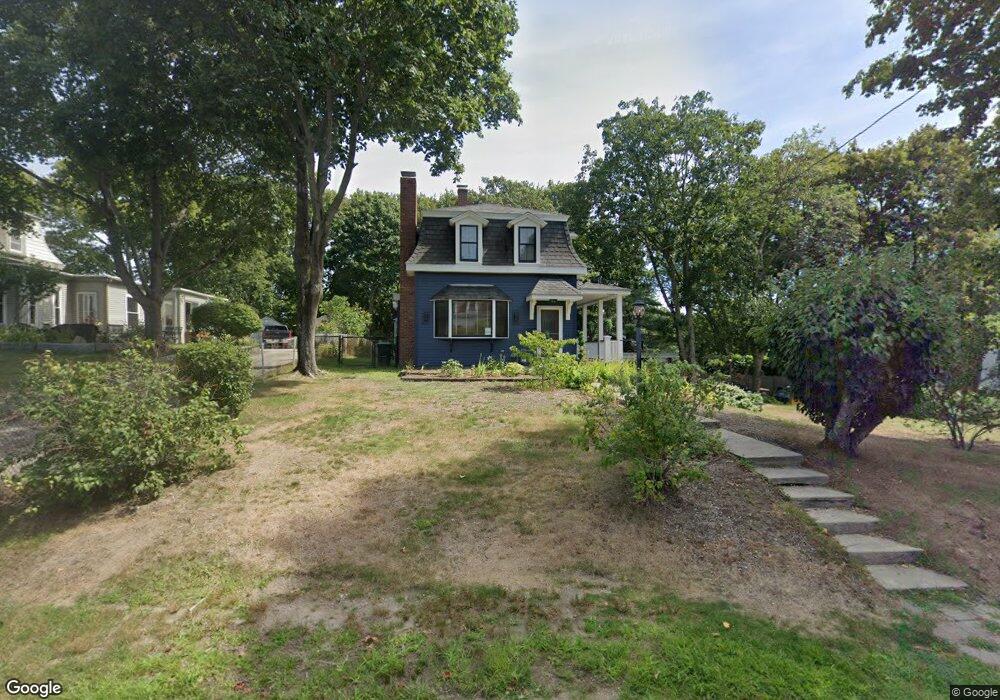
43 Putnam St East Weymouth, MA 02189
East Weymouth NeighborhoodEstimated Value: $672,967 - $810,000
3
Beds
2
Baths
2,123
Sq Ft
$359/Sq Ft
Est. Value
About This Home
This home is located at 43 Putnam St, East Weymouth, MA 02189 and is currently estimated at $762,992, approximately $359 per square foot. 43 Putnam St is a home located in Norfolk County with nearby schools including Abigail Adams Middle School, Weymouth Middle School Chapman, and Weymouth High School.
Ownership History
Date
Name
Owned For
Owner Type
Purchase Details
Closed on
Jan 15, 2004
Sold by
Dixon Susanj
Bought by
Blackmore Charles and Smith Martha
Current Estimated Value
Home Financials for this Owner
Home Financials are based on the most recent Mortgage that was taken out on this home.
Original Mortgage
$385,200
Outstanding Balance
$181,142
Interest Rate
5.98%
Mortgage Type
Purchase Money Mortgage
Estimated Equity
$581,850
Create a Home Valuation Report for This Property
The Home Valuation Report is an in-depth analysis detailing your home's value as well as a comparison with similar homes in the area
Home Values in the Area
Average Home Value in this Area
Purchase History
| Date | Buyer | Sale Price | Title Company |
|---|---|---|---|
| Blackmore Charles | $481,500 | -- |
Source: Public Records
Mortgage History
| Date | Status | Borrower | Loan Amount |
|---|---|---|---|
| Open | Blackmore Charles | $385,200 |
Source: Public Records
Tax History Compared to Growth
Tax History
| Year | Tax Paid | Tax Assessment Tax Assessment Total Assessment is a certain percentage of the fair market value that is determined by local assessors to be the total taxable value of land and additions on the property. | Land | Improvement |
|---|---|---|---|---|
| 2025 | $5,677 | $562,100 | $207,200 | $354,900 |
| 2024 | $5,504 | $535,900 | $197,400 | $338,500 |
| 2023 | $5,477 | $524,100 | $182,800 | $341,300 |
| 2022 | $5,324 | $464,600 | $169,200 | $295,400 |
| 2021 | $5,018 | $427,400 | $169,200 | $258,200 |
| 2020 | $4,816 | $404,000 | $169,200 | $234,800 |
| 2019 | $4,700 | $387,800 | $162,700 | $225,100 |
| 2018 | $4,553 | $364,200 | $155,000 | $209,200 |
| 2017 | $4,348 | $339,400 | $147,600 | $191,800 |
| 2016 | $4,178 | $326,400 | $141,900 | $184,500 |
| 2015 | $4,213 | $326,600 | $141,900 | $184,700 |
| 2014 | $4,043 | $304,000 | $132,100 | $171,900 |
Source: Public Records
Map
Nearby Homes
- 56 Putnam St
- 575 Broad St Unit 305
- 575 Broad St Unit 215
- 425 East St
- 29-31 Broad Street Place
- 30 Puritan Rd
- 209 Lake St Unit 69
- 303 Middle St
- 17 Grove St
- 38 School St Unit 2
- 1297 Pleasant St
- 145 Jaffrey St
- 20 Richards Rd
- 2 Winstead Rd
- 10 Duck Ln
- 42 Sundin Rd
- 286 Essex St
- 367 Essex St
- 669 Commercial St
- 449 Middle St
- 49 Putnam St
- 27 Putnam St
- 2 Lafayette Ave
- 59 Putnam St Unit 59
- 00 Chard St
- 00 Chard St Unit 1
- 53 Putnam St Unit 55
- 57 Putnam St Unit 59
- 28 Putnam St
- 42 Putnam St
- 6 Lafayette Ave
- 46 Putnam St
- 25 Putnam St
- 15 Lafayette Ave
- 52 Putnam St
- 14 Lafayette Ave
- 14 Chard St
- 21 Putnam St
- 18 Lafayette Ave
- 23 Lafayette Ave