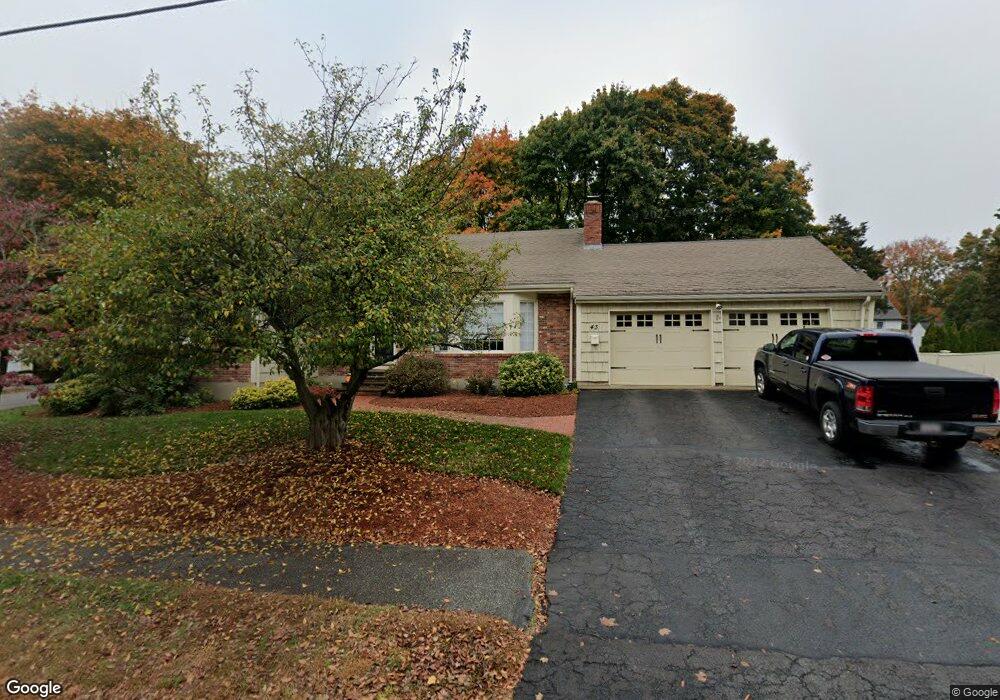
43 Red Gate Ln Reading, MA 01867
Estimated Value: $978,658 - $1,111,000
3
Beds
2
Baths
1,723
Sq Ft
$594/Sq Ft
Est. Value
About This Home
This home is located at 43 Red Gate Ln, Reading, MA 01867 and is currently estimated at $1,023,915, approximately $594 per square foot. 43 Red Gate Ln is a home located in Middlesex County with nearby schools including Joshua Eaton Elementary School, Walter S. Parker Middle School, and Reading Memorial High School.
Ownership History
Date
Name
Owned For
Owner Type
Purchase Details
Closed on
Jan 3, 2017
Sold by
Willson Richard E and Willson Joyce M
Bought by
Willson Nt and Willson
Current Estimated Value
Purchase Details
Closed on
Nov 9, 2001
Sold by
Schneider Rodney P and Schneider Christine
Bought by
Willson Richard F and Willson Joyce M
Home Financials for this Owner
Home Financials are based on the most recent Mortgage that was taken out on this home.
Original Mortgage
$322,000
Interest Rate
6.77%
Mortgage Type
Purchase Money Mortgage
Purchase Details
Closed on
Oct 24, 1997
Sold by
Hope Muriel V Est and Hope
Bought by
Schneider Rodney P and Schneider Christine A
Home Financials for this Owner
Home Financials are based on the most recent Mortgage that was taken out on this home.
Original Mortgage
$214,600
Interest Rate
7.48%
Mortgage Type
Purchase Money Mortgage
Create a Home Valuation Report for This Property
The Home Valuation Report is an in-depth analysis detailing your home's value as well as a comparison with similar homes in the area
Home Values in the Area
Average Home Value in this Area
Purchase History
| Date | Buyer | Sale Price | Title Company |
|---|---|---|---|
| Willson Nt | -- | -- | |
| Willson Richard F | $460,000 | -- | |
| Schneider Rodney P | $278,000 | -- |
Source: Public Records
Mortgage History
| Date | Status | Borrower | Loan Amount |
|---|---|---|---|
| Previous Owner | Schneider Rodney P | $170,000 | |
| Previous Owner | Willson Richard F | $322,000 | |
| Previous Owner | Schneider Rodney P | $227,000 | |
| Previous Owner | Schneider Rodney P | $214,600 | |
| Previous Owner | Schneider Rodney P | $15,000 |
Source: Public Records
Tax History Compared to Growth
Tax History
| Year | Tax Paid | Tax Assessment Tax Assessment Total Assessment is a certain percentage of the fair market value that is determined by local assessors to be the total taxable value of land and additions on the property. | Land | Improvement |
|---|---|---|---|---|
| 2025 | $10,310 | $905,200 | $566,700 | $338,500 |
| 2024 | $10,437 | $890,500 | $557,500 | $333,000 |
| 2023 | $9,823 | $780,200 | $488,400 | $291,800 |
| 2022 | $9,811 | $736,000 | $460,700 | $275,300 |
| 2021 | $9,363 | $678,000 | $421,600 | $256,400 |
| 2020 | $4,551 | $644,600 | $400,800 | $243,800 |
| 2019 | $8,619 | $605,700 | $376,600 | $229,100 |
| 2018 | $7,862 | $566,800 | $352,400 | $214,400 |
| 2017 | $4,661 | $555,700 | $345,500 | $210,200 |
| 2016 | $8,422 | $580,800 | $341,100 | $239,700 |
| 2015 | $7,762 | $528,000 | $310,100 | $217,900 |
| 2014 | $7,783 | $528,000 | $310,100 | $217,900 |
Source: Public Records
Map
Nearby Homes
- 89 Walnut St
- 133 Pine Ridge Rd
- 237 Main St Unit A4
- 62 Abigail Way Unit 2007
- 62 Abigail Way Unit 3004
- 7 Leaning Elm Dr Unit 7
- 246 Walnut St
- 175 West St
- 35 Park Ave
- 24 Minot St
- 577 Summer Ave
- 75 Border Rd
- 57 Wescroft Rd
- 2 Summit Dr Unit 18
- 13 Elaine Rd
- 266 West St
- 5 Washington St Unit B2
- 103 High St
- 101 King St Unit 101
- 77 Mount Vernon St
- 37 Red Gate Ln
- 34 Virginia Rd
- 32 Virginia Rd
- 26 Virginia Rd
- 46 Red Gate Ln
- 40 Red Gate Ln
- 25 Indiana Ave
- 31 Red Gate Ln
- 52 Red Gate Ln
- 55 Red Gate Ln
- 22 Virginia Rd
- 32 Red Gate Ln
- 21 Indiana Ave
- 33 Virginia Rd
- 25 Strawberry Hill Ln
- 56 Red Gate Ln
- 18 Virginia Rd
- 43 Pennsylvania Ave
- 27 Virginia Rd
- 61 Red Gate Ln