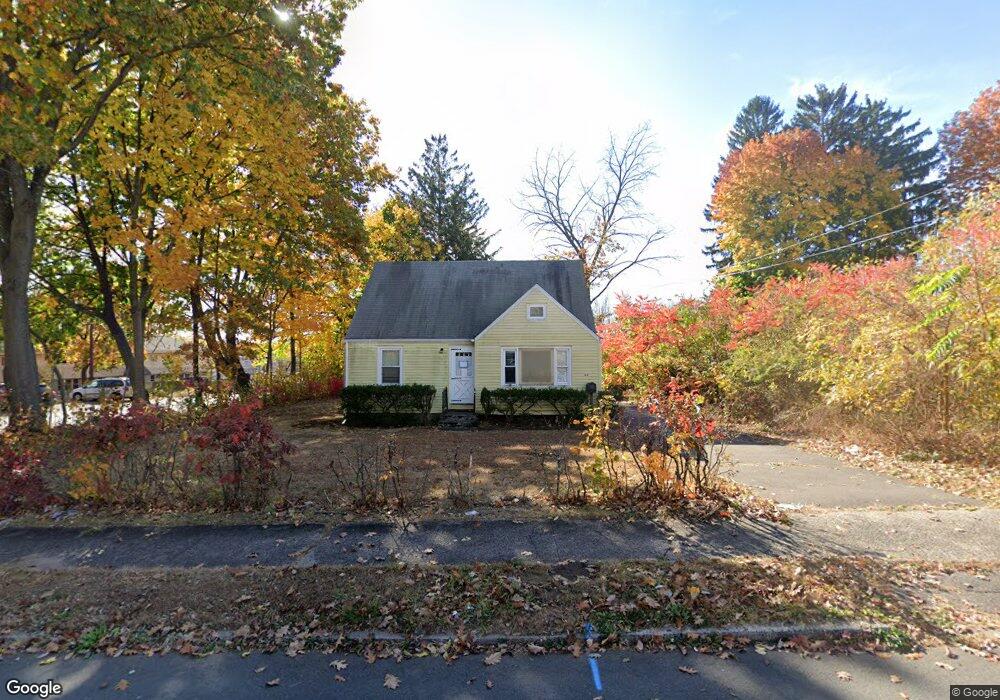
43 Richard St New Britain, CT 06053
Estimated Value: $189,000 - $242,782
2
Beds
1
Bath
756
Sq Ft
$296/Sq Ft
Est. Value
About This Home
This home is located at 43 Richard St, New Britain, CT 06053 and is currently estimated at $223,446, approximately $295 per square foot. 43 Richard St is a home located in Hartford County with nearby schools including Lincoln School, Slade Middle School, and Mountain Laurel Sudbury School.
Ownership History
Date
Name
Owned For
Owner Type
Purchase Details
Closed on
Aug 30, 2024
Sold by
Kelsey Sandra L and Nationstar Mortgage Llc
Bought by
St Cyr Phillip H
Current Estimated Value
Purchase Details
Closed on
Feb 5, 1990
Sold by
Jones Alan R
Bought by
Kelley Gerald V
Home Financials for this Owner
Home Financials are based on the most recent Mortgage that was taken out on this home.
Original Mortgage
$122,700
Interest Rate
9.59%
Mortgage Type
Purchase Money Mortgage
Create a Home Valuation Report for This Property
The Home Valuation Report is an in-depth analysis detailing your home's value as well as a comparison with similar homes in the area
Home Values in the Area
Average Home Value in this Area
Purchase History
| Date | Buyer | Sale Price | Title Company |
|---|---|---|---|
| St Cyr Phillip H | $173,000 | None Available | |
| St Cyr Phillip H | $173,000 | None Available | |
| Kelley Gerald V | $121,800 | -- |
Source: Public Records
Mortgage History
| Date | Status | Borrower | Loan Amount |
|---|---|---|---|
| Previous Owner | Kelley Gerald V | $112,942 | |
| Previous Owner | Kelley Gerald V | $115,695 | |
| Previous Owner | Kelley Gerald V | $107,215 | |
| Previous Owner | Kelley Gerald V | $122,700 |
Source: Public Records
Tax History Compared to Growth
Tax History
| Year | Tax Paid | Tax Assessment Tax Assessment Total Assessment is a certain percentage of the fair market value that is determined by local assessors to be the total taxable value of land and additions on the property. | Land | Improvement |
|---|---|---|---|---|
| 2025 | $3,897 | $99,470 | $43,050 | $56,420 |
| 2024 | $3,938 | $99,470 | $43,050 | $56,420 |
| 2023 | $3,808 | $99,470 | $43,050 | $56,420 |
| 2022 | $3,222 | $65,100 | $14,280 | $50,820 |
| 2021 | $3,222 | $65,100 | $14,280 | $50,820 |
| 2020 | $3,288 | $65,100 | $14,280 | $50,820 |
| 2019 | $3,288 | $65,100 | $14,280 | $50,820 |
| 2018 | $3,288 | $65,100 | $14,280 | $50,820 |
| 2017 | $3,047 | $60,340 | $14,910 | $45,430 |
| 2016 | $3,047 | $60,340 | $14,910 | $45,430 |
| 2015 | $2,957 | $60,340 | $14,910 | $45,430 |
| 2014 | $2,957 | $60,340 | $14,910 | $45,430 |
Source: Public Records
Map
Nearby Homes
- 1467 Corbin Ave
- 1485 Corbin Ave
- 43 Westerly St
- 108 Overhill Ave
- 30 Westerly St
- 8 Albany Ave
- 25 Clinton St
- 23 Ledyard Rd
- 335 Broad St
- 817 W Main St
- 42 Fairlane Dr
- 87 Pinehurst Ave
- 115 Beechwood Dr
- 96 Garden St
- 66 Lincoln St
- 179 Broad St
- 230 Hillhurst Ave
- 19 Maplehurst Ave
- 71 Pennsylvania Ave
- 112 Lincoln St