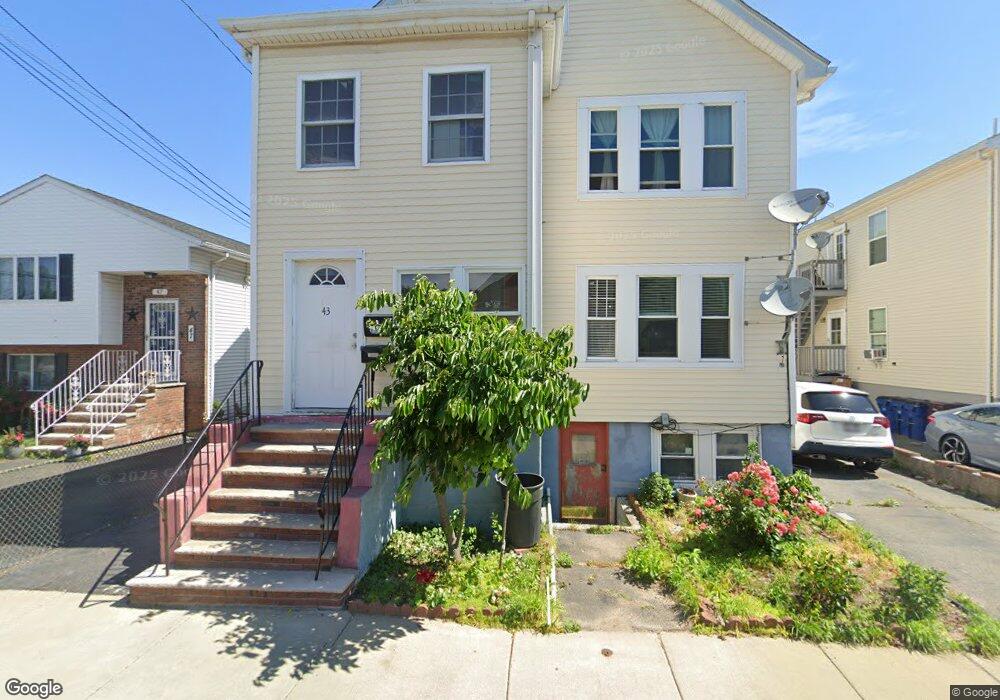
43 Rumney Rd Revere, MA 02151
West Revere NeighborhoodEstimated Value: $758,932 - $906,000
6
Beds
2
Baths
2,184
Sq Ft
$384/Sq Ft
Est. Value
About This Home
This home is located at 43 Rumney Rd, Revere, MA 02151 and is currently estimated at $837,733, approximately $383 per square foot. 43 Rumney Rd is a home located in Suffolk County with nearby schools including Abraham Lincoln School, Staff Sargent James J. Hill Elementary School, and Rumney Marsh Academy.
Ownership History
Date
Name
Owned For
Owner Type
Purchase Details
Closed on
Jan 28, 2003
Sold by
Corcoran Robert S and Corcoran John R
Bought by
Bui Thu Thuy and Bui Thanh
Current Estimated Value
Home Financials for this Owner
Home Financials are based on the most recent Mortgage that was taken out on this home.
Original Mortgage
$355,500
Interest Rate
6.11%
Mortgage Type
Purchase Money Mortgage
Purchase Details
Closed on
Oct 18, 2002
Sold by
Selvitella John and Selvitella Michael
Bought by
Corcoran Robert S and Corcoran John R
Create a Home Valuation Report for This Property
The Home Valuation Report is an in-depth analysis detailing your home's value as well as a comparison with similar homes in the area
Home Values in the Area
Average Home Value in this Area
Purchase History
| Date | Buyer | Sale Price | Title Company |
|---|---|---|---|
| Bui Thu Thuy | $395,000 | -- | |
| Bui Thu Thuy | $395,000 | -- | |
| Corcoran Robert S | $350,000 | -- |
Source: Public Records
Mortgage History
| Date | Status | Borrower | Loan Amount |
|---|---|---|---|
| Open | Corcoran Robert S | $355,500 | |
| Closed | Corcoran Robert S | $355,500 |
Source: Public Records
Tax History Compared to Growth
Tax History
| Year | Tax Paid | Tax Assessment Tax Assessment Total Assessment is a certain percentage of the fair market value that is determined by local assessors to be the total taxable value of land and additions on the property. | Land | Improvement |
|---|---|---|---|---|
| 2025 | $6,432 | $709,200 | $286,000 | $423,200 |
| 2024 | $6,348 | $696,800 | $270,100 | $426,700 |
| 2023 | $6,034 | $634,500 | $225,600 | $408,900 |
| 2022 | $6,047 | $581,400 | $214,500 | $366,900 |
| 2021 | $5,922 | $535,400 | $198,600 | $336,800 |
| 2020 | $5,869 | $521,200 | $198,600 | $322,600 |
| 2019 | $5,630 | $464,900 | $181,100 | $283,800 |
| 2018 | $5,638 | $435,000 | $163,600 | $271,400 |
| 2017 | $5,402 | $386,100 | $143,000 | $243,100 |
| 2016 | $4,420 | $305,900 | $130,300 | $175,600 |
| 2015 | $4,527 | $305,900 | $130,300 | $175,600 |
Source: Public Records
Map
Nearby Homes
- 74 Gage Ave
- 21 Beach Rd
- 44 Stark Ave Unit B
- 8 Revere St Unit 6
- 8 Revere St Unit 8
- 55 Revere St
- 45 McCoba St Unit 50
- 71 Ambrose St
- 35 Tuttle St
- 14 Larkin St
- 181 Fenley St
- 92 Tuttle St
- 291 Revere St Unit 11
- 238 Malden St
- 16 Hawes St
- 95 Bates St
- 59 Carlson Ave
- 144 Orvis Rd
- 26 Newhall St
- 43 Washington St