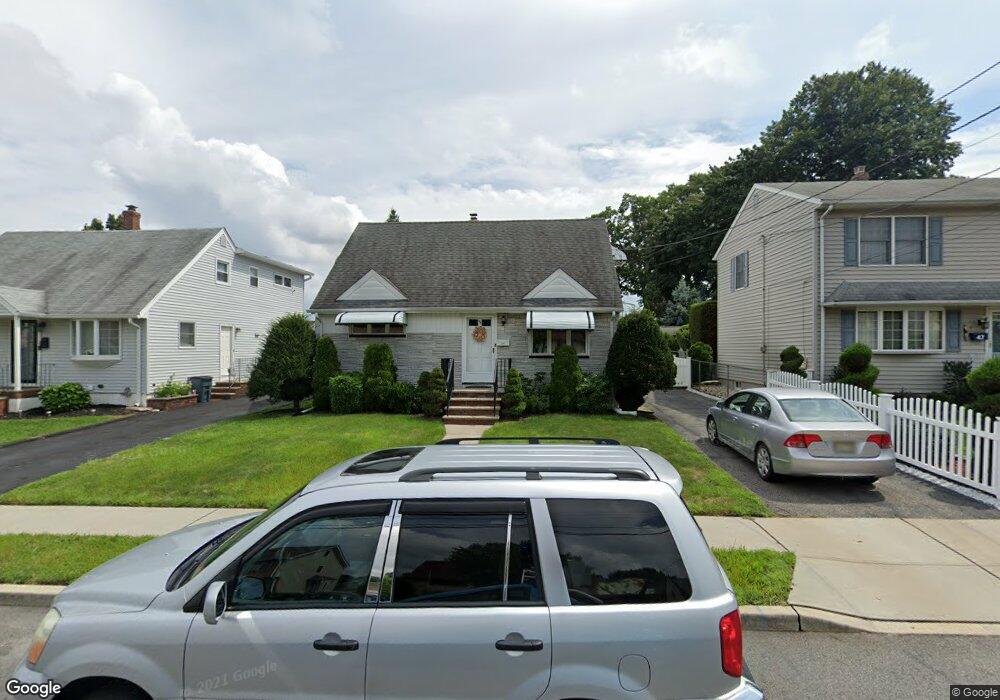
43 Runyon Rd Clifton, NJ 07013
Richfield NeighborhoodEstimated Value: $489,606 - $611,000
--
Bed
--
Bath
972
Sq Ft
$553/Sq Ft
Est. Value
About This Home
This home is located at 43 Runyon Rd, Clifton, NJ 07013 and is currently estimated at $537,902, approximately $553 per square foot. 43 Runyon Rd is a home located in Passaic County with nearby schools including Clifton High School, St Andrew Elementary School, and New Hope School.
Ownership History
Date
Name
Owned For
Owner Type
Purchase Details
Closed on
May 16, 2007
Sold by
Zielinsky Frances A and Zielinsky Albert T
Bought by
Castrillon Jessica and Castrillon Juan
Current Estimated Value
Home Financials for this Owner
Home Financials are based on the most recent Mortgage that was taken out on this home.
Original Mortgage
$54,400
Outstanding Balance
$33,377
Interest Rate
6.24%
Mortgage Type
Credit Line Revolving
Estimated Equity
$504,525
Create a Home Valuation Report for This Property
The Home Valuation Report is an in-depth analysis detailing your home's value as well as a comparison with similar homes in the area
Home Values in the Area
Average Home Value in this Area
Purchase History
| Date | Buyer | Sale Price | Title Company |
|---|---|---|---|
| Castrillon Jessica | $363,000 | -- |
Source: Public Records
Mortgage History
| Date | Status | Borrower | Loan Amount |
|---|---|---|---|
| Open | Castrillon Jessica | $54,400 | |
| Open | Castrillon Jessica | $290,400 |
Source: Public Records
Tax History Compared to Growth
Tax History
| Year | Tax Paid | Tax Assessment Tax Assessment Total Assessment is a certain percentage of the fair market value that is determined by local assessors to be the total taxable value of land and additions on the property. | Land | Improvement |
|---|---|---|---|---|
| 2025 | $8,649 | $145,700 | $92,500 | $53,200 |
| 2024 | $8,442 | $145,700 | $92,500 | $53,200 |
| 2022 | $8,319 | $145,700 | $92,500 | $53,200 |
| 2021 | $7,977 | $145,700 | $92,500 | $53,200 |
| 2020 | $8,003 | $145,700 | $92,500 | $53,200 |
| 2019 | $7,946 | $145,700 | $92,500 | $53,200 |
| 2018 | $7,901 | $145,700 | $92,500 | $53,200 |
| 2017 | $7,815 | $145,700 | $92,500 | $53,200 |
| 2016 | $7,664 | $145,700 | $92,500 | $53,200 |
| 2015 | $7,590 | $145,700 | $92,500 | $53,200 |
| 2014 | $7,434 | $145,700 | $92,500 | $53,200 |
Source: Public Records
Map
Nearby Homes