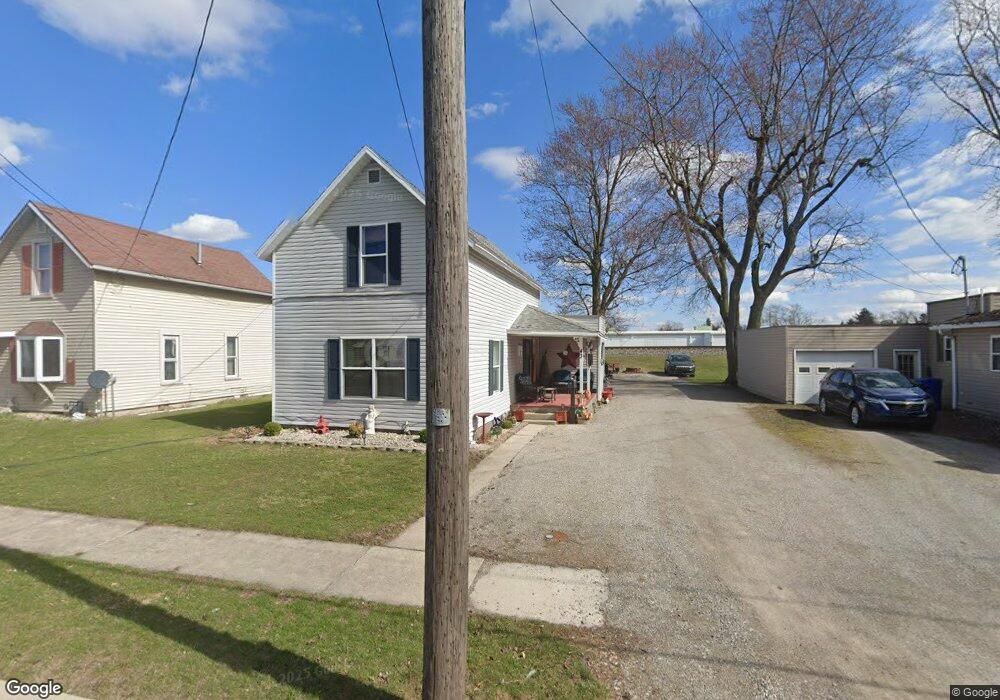
43 S Belmore St Leipsic, OH 45856
Estimated Value: $117,252 - $141,000
3
Beds
1
Bath
1,216
Sq Ft
$106/Sq Ft
Est. Value
About This Home
This home is located at 43 S Belmore St, Leipsic, OH 45856 and is currently estimated at $128,813, approximately $105 per square foot. 43 S Belmore St is a home with nearby schools including Leipsic Elementary School, Leipsic High School, and St. Mary Elementary School.
Ownership History
Date
Name
Owned For
Owner Type
Purchase Details
Closed on
Oct 26, 2006
Sold by
Teders Kenneth J and Teders Darlene L
Bought by
Villasana Juan and Villasana Yolanda
Current Estimated Value
Home Financials for this Owner
Home Financials are based on the most recent Mortgage that was taken out on this home.
Original Mortgage
$62,000
Outstanding Balance
$36,308
Interest Rate
6.5%
Mortgage Type
New Conventional
Estimated Equity
$92,505
Purchase Details
Closed on
Jun 6, 2005
Sold by
Anger Roger C and Anger Robert E
Bought by
Teders Kenneth J and Teders Darlene L
Create a Home Valuation Report for This Property
The Home Valuation Report is an in-depth analysis detailing your home's value as well as a comparison with similar homes in the area
Purchase History
| Date | Buyer | Sale Price | Title Company |
|---|---|---|---|
| Villasana Juan | $66,000 | None Available | |
| Teders Kenneth J | $19,500 | None Available |
Source: Public Records
Mortgage History
| Date | Status | Borrower | Loan Amount |
|---|---|---|---|
| Open | Villasana Juan | $62,000 |
Source: Public Records
Tax History
| Year | Tax Paid | Tax Assessment Tax Assessment Total Assessment is a certain percentage of the fair market value that is determined by local assessors to be the total taxable value of land and additions on the property. | Land | Improvement |
|---|---|---|---|---|
| 2025 | $748 | $24,310 | $2,640 | $21,670 |
| 2024 | $774 | $24,310 | $2,640 | $21,670 |
| 2023 | $809 | $19,240 | $2,070 | $17,170 |
| 2022 | $784 | $19,240 | $2,069 | $17,171 |
| 2021 | $788 | $19,240 | $2,069 | $17,171 |
| 2020 | $785 | $8,130 | $1,840 | $6,290 |
| 2019 | $630 | $15,970 | $2,070 | $13,900 |
| 2018 | $611 | $15,970 | $2,070 | $13,900 |
| 2017 | $288 | $15,970 | $2,070 | $13,900 |
| 2016 | $288 | $8,130 | $1,840 | $6,290 |
| 2015 | $283 | $8,130 | $1,840 | $6,290 |
| 2014 | $276 | $8,130 | $1,840 | $6,290 |
| 2013 | $285 | $8,130 | $1,840 | $6,290 |
Source: Public Records
Map
Nearby Homes
- 35 S Belmore St
- 47 S Belmore St
- 31 S Belmore St
- 55 S Belmore St
- 48 S Belmore St
- 42 Belmore St
- 58 S Belmore St
- 29 S Belmore St
- 52 S Belmore St
- 42 S Belmore St
- 64 S Belmore St
- 30 S Belmore St
- 70 S Belmore St
- 15 S Belmore St
- 24 S Belmore St
- 25 S Commercial St
- 19 S Commercial St
- 16 S Belmore St
- 9 S Belmore St
- 125 E Liberty St
Your Personal Tour Guide
Ask me questions while you tour the home.