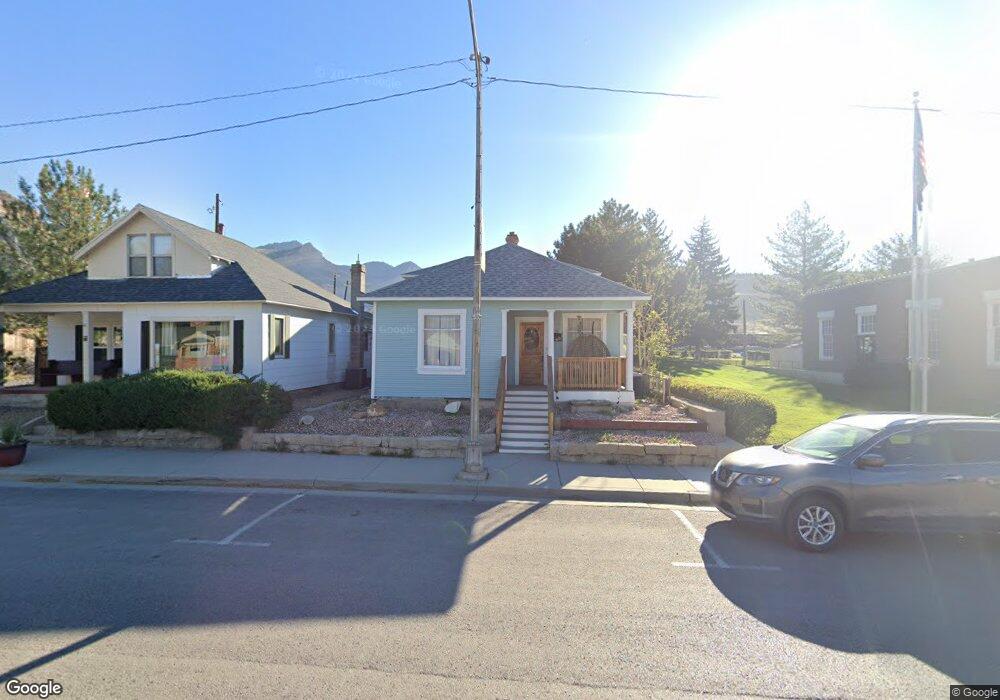
43 S Main St Helper, UT 84526
Estimated Value: $238,000 - $345,000
2
Beds
2
Baths
2,023
Sq Ft
$140/Sq Ft
Est. Value
About This Home
This home is located at 43 S Main St, Helper, UT 84526 and is currently estimated at $283,312, approximately $140 per square foot. 43 S Main St is a home located in Carbon County with nearby schools including Sally Mauro School, Helper Middle School, and Carbon High School.
Ownership History
Date
Name
Owned For
Owner Type
Purchase Details
Closed on
Sep 9, 2024
Sold by
Bunderson Matthew
Bought by
Bunderson Taryn Anna and Bunderson Mathew Cody
Current Estimated Value
Home Financials for this Owner
Home Financials are based on the most recent Mortgage that was taken out on this home.
Original Mortgage
$258,750
Outstanding Balance
$255,743
Interest Rate
6.73%
Mortgage Type
New Conventional
Estimated Equity
$27,569
Purchase Details
Closed on
May 24, 2017
Sold by
Davidson Marie G and Marie G Davidson Family Trust
Bought by
Bunderson Taryn Anna and Bunderson Mathew Cody
Home Financials for this Owner
Home Financials are based on the most recent Mortgage that was taken out on this home.
Original Mortgage
$101,150
Interest Rate
4.08%
Mortgage Type
New Conventional
Create a Home Valuation Report for This Property
The Home Valuation Report is an in-depth analysis detailing your home's value as well as a comparison with similar homes in the area
Home Values in the Area
Average Home Value in this Area
Purchase History
| Date | Buyer | Sale Price | Title Company |
|---|---|---|---|
| Bunderson Taryn Anna | -- | Us Title | |
| Bunderson Mathew | -- | None Listed On Document | |
| Bunderson Taryn Anna | -- | Professional Title Services |
Source: Public Records
Mortgage History
| Date | Status | Borrower | Loan Amount |
|---|---|---|---|
| Open | Bunderson Mathew | $258,750 | |
| Previous Owner | Bunderson Taryn Anna | $101,150 |
Source: Public Records
Tax History
| Year | Tax Paid | Tax Assessment Tax Assessment Total Assessment is a certain percentage of the fair market value that is determined by local assessors to be the total taxable value of land and additions on the property. | Land | Improvement |
|---|---|---|---|---|
| 2025 | $991 | $77,565 | $13,213 | $64,352 |
| 2024 | $1,559 | $126,226 | $14,728 | $111,498 |
| 2023 | $1,380 | $116,988 | $17,185 | $99,803 |
| 2022 | $1,217 | $90,812 | $11,916 | $78,896 |
| 2021 | $1,073 | $125,474 | $15,300 | $110,174 |
| 2020 | $1,020 | $59,909 | $0 | $0 |
| 2019 | $837 | $50,727 | $0 | $0 |
| 2018 | $813 | $50,727 | $0 | $0 |
| 2017 | $804 | $50,727 | $0 | $0 |
| 2016 | $737 | $50,727 | $0 | $0 |
| 2015 | $737 | $50,727 | $0 | $0 |
| 2014 | $787 | $54,360 | $0 | $0 |
| 2013 | $789 | $54,360 | $0 | $0 |
Source: Public Records
Map
Nearby Homes
- 2350 N 1075 W
- 10 S 100 W
- 97 Welby St
- 79 Garden St
- 73 Garden St
- 47 B St
- 57 C St
- 347 Hill St
- 46 E St
- 819 Castle Gate Cir
- 1377 Frontage Rd
- 1630 W 4200 N Unit 5
- 5441 N Eagle Dr
- 451 E 6000 N
- 5931 N 550 E
- 49 Aspen Cove Dr Unit 49
- 135 Aspen Dr Unit 135
- 109 Aspen Cove Dr Unit 109
- 5350 Dry Valley Rd Unit 61
- 24 N Dry Valley Rd Unit 24
Your Personal Tour Guide
Ask me questions while you tour the home.