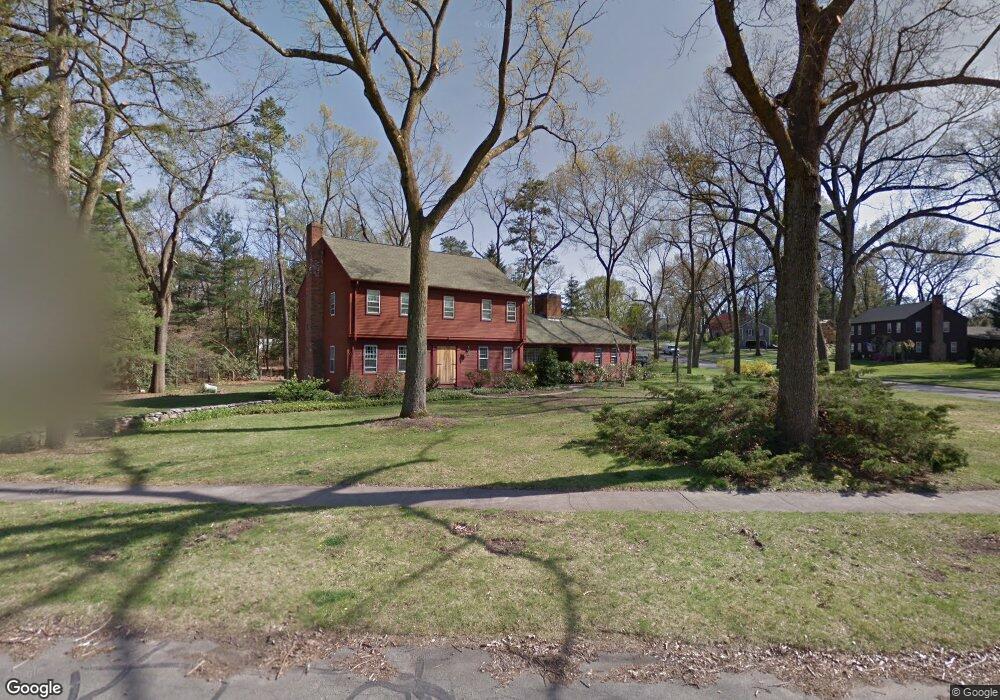
43 Salem Rd Longmeadow, MA 01106
Estimated Value: $673,000 - $689,000
4
Beds
3
Baths
2,620
Sq Ft
$261/Sq Ft
Est. Value
About This Home
This home is located at 43 Salem Rd, Longmeadow, MA 01106 and is currently estimated at $682,952, approximately $260 per square foot. 43 Salem Rd is a home located in Hampden County with nearby schools including Blueberry Hill, Williams Middle School, and Longmeadow High School.
Ownership History
Date
Name
Owned For
Owner Type
Purchase Details
Closed on
Feb 25, 2019
Sold by
Chapdelaine David G
Bought by
Kantany James G and Kantany Kristin E
Current Estimated Value
Home Financials for this Owner
Home Financials are based on the most recent Mortgage that was taken out on this home.
Original Mortgage
$484,350
Outstanding Balance
$425,826
Interest Rate
4.4%
Mortgage Type
Purchase Money Mortgage
Estimated Equity
$257,126
Purchase Details
Closed on
Nov 26, 2018
Sold by
Compton Allan K
Bought by
Chapdelaine David G
Purchase Details
Closed on
Jul 9, 2018
Sold by
Compton Allan K and Compton Janet N
Bought by
Compton Allan K
Create a Home Valuation Report for This Property
The Home Valuation Report is an in-depth analysis detailing your home's value as well as a comparison with similar homes in the area
Home Values in the Area
Average Home Value in this Area
Purchase History
| Date | Buyer | Sale Price | Title Company |
|---|---|---|---|
| Kantany James G | $375,000 | -- | |
| Chapdelaine David G | $290,000 | -- | |
| Compton Allan K | -- | -- |
Source: Public Records
Mortgage History
| Date | Status | Borrower | Loan Amount |
|---|---|---|---|
| Open | Kantany James G | $484,350 |
Source: Public Records
Tax History
| Year | Tax Paid | Tax Assessment Tax Assessment Total Assessment is a certain percentage of the fair market value that is determined by local assessors to be the total taxable value of land and additions on the property. | Land | Improvement |
|---|---|---|---|---|
| 2025 | $12,292 | $582,000 | $224,100 | $357,900 |
| 2024 | $12,036 | $582,000 | $224,100 | $357,900 |
| 2023 | $11,277 | $492,000 | $174,700 | $317,300 |
| 2022 | $11,083 | $449,800 | $182,400 | $267,400 |
| 2021 | $10,853 | $438,700 | $181,300 | $257,400 |
| 2020 | $8,904 | $367,800 | $196,600 | $171,200 |
| 2019 | $9,850 | $408,900 | $196,600 | $212,300 |
| 2018 | $9,195 | $378,200 | $211,700 | $166,500 |
| 2017 | $8,918 | $378,200 | $211,700 | $166,500 |
| 2016 | $8,618 | $354,200 | $197,700 | $156,500 |
| 2015 | $8,319 | $352,200 | $195,700 | $156,500 |
Source: Public Records
Map
Nearby Homes
- 59 Lawrence Dr
- 112 Grassy Gutter Rd
- 170 Hopkins Place
- 124 Tecumseh Dr
- 153 Porter Lake Dr Unit 153
- 642 Laurel St
- 83 Bliss Rd
- 55 Dover Rd
- 20 Kimberly Cir
- 20 Jamestown Dr Unit B
- 1155 Dickinson St
- 40 Halifax Ct Unit D
- 114 Park Dr
- 64 Magnolia Cir
- 53 Ashford Rd
- 32 Edgewood Ave
- 330 Merriweather Dr
- 111 Ashford Rd
- 55 Fernleaf Ave
- 0 Dennis Rd
Your Personal Tour Guide
Ask me questions while you tour the home.