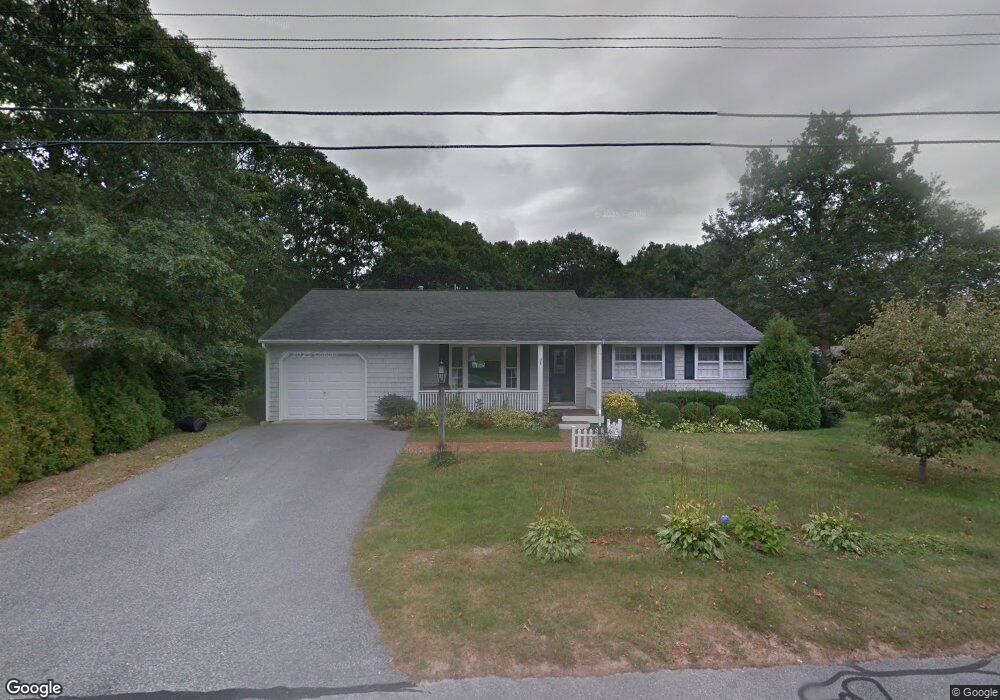
43 Sally Ln East Falmouth, MA 02536
Estimated Value: $851,000 - $1,349,222
3
Beds
2
Baths
1,210
Sq Ft
$922/Sq Ft
Est. Value
About This Home
This home is located at 43 Sally Ln, East Falmouth, MA 02536 and is currently estimated at $1,115,306, approximately $921 per square foot. 43 Sally Ln is a home located in Barnstable County with nearby schools including Teaticket Elementary School, Morse Pond School, and Lawrence School.
Ownership History
Date
Name
Owned For
Owner Type
Purchase Details
Closed on
Mar 28, 2024
Sold by
Summers Geoffrey P and Jeffries-Summers Linda
Bought by
Linda Jeffreis -Summers T and Linda Jeffries-Summers
Current Estimated Value
Purchase Details
Closed on
Oct 20, 2014
Sold by
Summers Denise L
Bought by
Summers Stephen and Summers Linda J
Home Financials for this Owner
Home Financials are based on the most recent Mortgage that was taken out on this home.
Original Mortgage
$265,000
Interest Rate
4.09%
Mortgage Type
New Conventional
Purchase Details
Closed on
Jul 6, 2009
Sold by
Keefe Peter W and Keefe Ellen C
Bought by
Summers Stephen and Summers Denise L
Home Financials for this Owner
Home Financials are based on the most recent Mortgage that was taken out on this home.
Original Mortgage
$195,000
Interest Rate
4.86%
Mortgage Type
Purchase Money Mortgage
Purchase Details
Closed on
Feb 1, 2002
Sold by
Egasti Paul J and Egasti Marsha L
Bought by
Keefe Peter W
Purchase Details
Closed on
Apr 1, 1996
Sold by
Soares Adelino and Soares Irene
Bought by
Egasti Paul J and Egasti Marsha L
Purchase Details
Closed on
Jun 28, 1993
Sold by
Carlson Bernard J and Carlson Florence L
Bought by
Soares Adelino and Soares Irene
Create a Home Valuation Report for This Property
The Home Valuation Report is an in-depth analysis detailing your home's value as well as a comparison with similar homes in the area
Home Values in the Area
Average Home Value in this Area
Purchase History
| Date | Buyer | Sale Price | Title Company |
|---|---|---|---|
| Linda Jeffreis -Summers T | -- | None Available | |
| Linda Jeffreis -Summers T | -- | None Available | |
| Summers Stephen | -- | -- | |
| Summers Geoffrey P | $370,000 | -- | |
| Summers Stephen | -- | -- | |
| Summers Stephen | $382,750 | -- | |
| Summers Stephen | $382,750 | -- | |
| Keefe Peter W | $287,000 | -- | |
| Keefe Peter W | $287,000 | -- | |
| Egasti Paul J | $132,890 | -- | |
| Egasti Paul J | $132,890 | -- | |
| Soares Adelino | $135,000 | -- | |
| Soares Adelino | $135,000 | -- |
Source: Public Records
Mortgage History
| Date | Status | Borrower | Loan Amount |
|---|---|---|---|
| Previous Owner | Summers Geoffrey P | $265,000 | |
| Previous Owner | Soares Adelino | $0 | |
| Previous Owner | Summers Stephen | $195,000 |
Source: Public Records
Tax History Compared to Growth
Tax History
| Year | Tax Paid | Tax Assessment Tax Assessment Total Assessment is a certain percentage of the fair market value that is determined by local assessors to be the total taxable value of land and additions on the property. | Land | Improvement |
|---|---|---|---|---|
| 2025 | $6,799 | $1,158,300 | $296,500 | $861,800 |
| 2024 | $6,529 | $1,039,600 | $258,100 | $781,500 |
| 2023 | $3,257 | $470,700 | $206,500 | $264,200 |
| 2022 | $3,446 | $428,100 | $193,100 | $235,000 |
| 2021 | $3,436 | $404,200 | $193,100 | $211,100 |
| 2020 | $3,321 | $386,600 | $175,500 | $211,100 |
| 2019 | $3,213 | $375,400 | $175,500 | $199,900 |
| 2018 | $3,133 | $364,300 | $175,500 | $188,800 |
| 2017 | $3,047 | $357,200 | $175,500 | $181,700 |
| 2016 | $2,990 | $357,200 | $175,500 | $181,700 |
| 2015 | $2,925 | $357,200 | $175,500 | $181,700 |
| 2014 | $2,817 | $345,600 | $175,600 | $170,000 |
Source: Public Records
Map
Nearby Homes