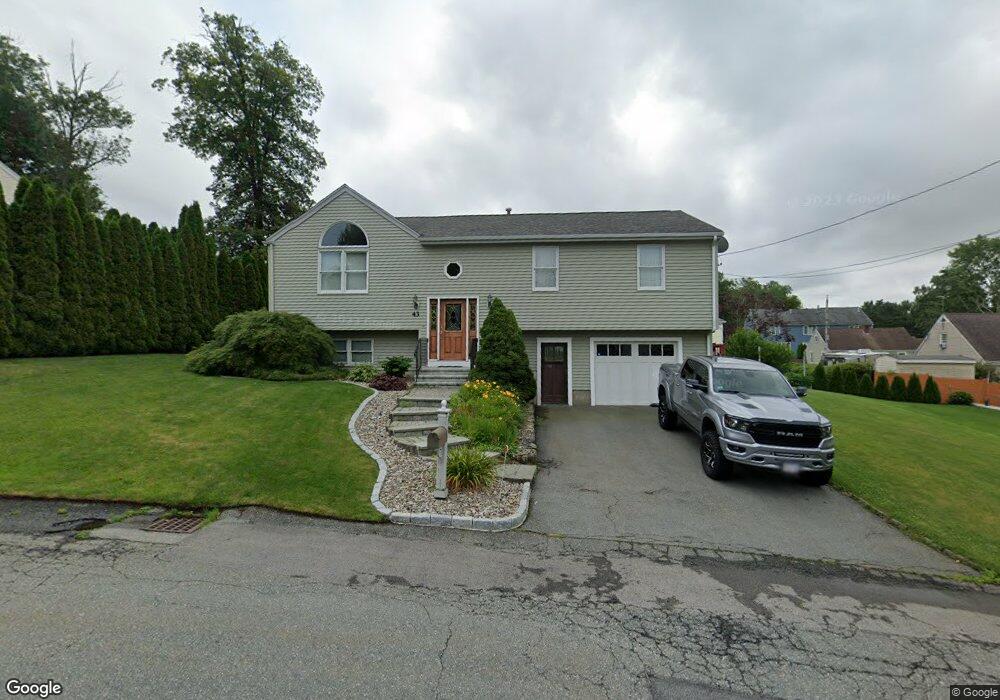
43 Sara Lynn Ct Fall River, MA 02720
Western Fall River NeighborhoodEstimated Value: $484,000 - $538,000
3
Beds
2
Baths
1,975
Sq Ft
$260/Sq Ft
Est. Value
About This Home
This home is located at 43 Sara Lynn Ct, Fall River, MA 02720 and is currently estimated at $514,289, approximately $260 per square foot. 43 Sara Lynn Ct is a home located in Bristol County with nearby schools including North End Elementary School, Morton Middle School, and B M C Durfee High School.
Ownership History
Date
Name
Owned For
Owner Type
Purchase Details
Closed on
Nov 13, 2003
Sold by
Sarah Lynn Court Nt
Bought by
Moniz John P
Current Estimated Value
Home Financials for this Owner
Home Financials are based on the most recent Mortgage that was taken out on this home.
Original Mortgage
$126,000
Outstanding Balance
$57,642
Interest Rate
5.81%
Mortgage Type
Purchase Money Mortgage
Estimated Equity
$456,647
Purchase Details
Closed on
Dec 22, 2000
Sold by
Family Homes Const Co
Bought by
Moniz Jose and Moniz John P
Home Financials for this Owner
Home Financials are based on the most recent Mortgage that was taken out on this home.
Original Mortgage
$80,000
Interest Rate
7.71%
Mortgage Type
Purchase Money Mortgage
Create a Home Valuation Report for This Property
The Home Valuation Report is an in-depth analysis detailing your home's value as well as a comparison with similar homes in the area
Home Values in the Area
Average Home Value in this Area
Purchase History
| Date | Buyer | Sale Price | Title Company |
|---|---|---|---|
| Moniz John P | -- | -- | |
| Moniz Jose | $144,900 | -- |
Source: Public Records
Mortgage History
| Date | Status | Borrower | Loan Amount |
|---|---|---|---|
| Open | Moniz Jose | $126,000 | |
| Previous Owner | Moniz Jose | $80,000 |
Source: Public Records
Tax History Compared to Growth
Tax History
| Year | Tax Paid | Tax Assessment Tax Assessment Total Assessment is a certain percentage of the fair market value that is determined by local assessors to be the total taxable value of land and additions on the property. | Land | Improvement |
|---|---|---|---|---|
| 2025 | $4,942 | $431,600 | $118,100 | $313,500 |
| 2024 | $4,510 | $392,500 | $115,800 | $276,700 |
| 2023 | $4,194 | $341,800 | $104,400 | $237,400 |
| 2022 | $3,802 | $301,300 | $98,500 | $202,800 |
| 2021 | $3,806 | $275,200 | $94,100 | $181,100 |
| 2020 | $3,763 | $260,400 | $89,800 | $170,600 |
| 2019 | $3,855 | $264,400 | $93,800 | $170,600 |
| 2018 | $3,645 | $249,300 | $94,500 | $154,800 |
| 2017 | $3,415 | $243,900 | $94,500 | $149,400 |
| 2016 | $3,129 | $229,600 | $97,400 | $132,200 |
| 2015 | $3,046 | $232,900 | $97,400 | $135,500 |
| 2014 | $2,930 | $232,900 | $97,400 | $135,500 |
Source: Public Records
Map
Nearby Homes
- 50 Clark St Unit 19
- 120 Terri Marie Way Unit 5-13
- 3682 N Main St Unit 7
- 3226 N Main St Unit 1
- 3216 N Main St
- 120 Lewin St Unit 30
- 3853 N Main St
- 3896 N Main St
- 2714 Riverside Ave
- 4234 N Main St Unit 103
- 2396 Riverside Ave
- 280 Joseph Dr
- 104 Corbett St
- 54 Grant Ave
- 81 Wood St
- 410 Joseph Dr
- 135 Grove Ave
- Parcel 2 Highcrest Rd
- 2022-2030 Highland Ave
- 172 Gibbs St