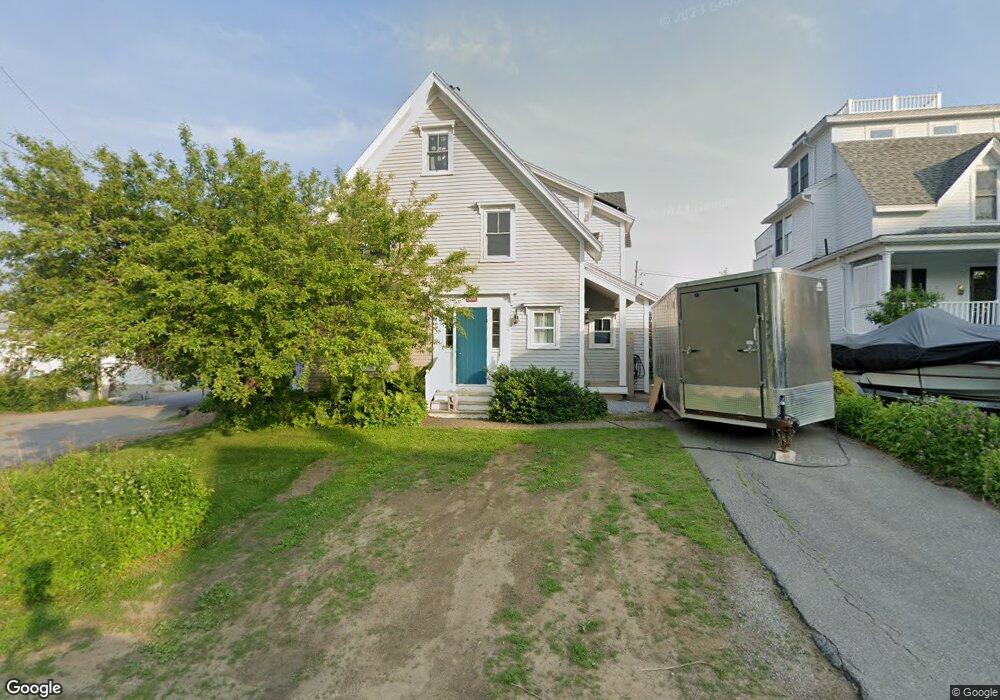
43 Sea St Camden, ME 04843
Estimated Value: $826,000 - $1,231,119
3
Beds
2
Baths
1,784
Sq Ft
$557/Sq Ft
Est. Value
About This Home
This home is located at 43 Sea St, Camden, ME 04843 and is currently estimated at $994,530, approximately $557 per square foot. 43 Sea St is a home located in Knox County with nearby schools including Camden-Rockport Elementary School, Camden-Rockport Middle School, and Camden Hills Regional High School.
Ownership History
Date
Name
Owned For
Owner Type
Purchase Details
Closed on
Nov 7, 2011
Sold by
Weatherwax Michael S and Weatherwax Priscilla R
Bought by
Cahoon Betsy K and Cahoon Edward C
Current Estimated Value
Home Financials for this Owner
Home Financials are based on the most recent Mortgage that was taken out on this home.
Original Mortgage
$290,400
Outstanding Balance
$198,598
Interest Rate
4.08%
Mortgage Type
Purchase Money Mortgage
Estimated Equity
$795,932
Create a Home Valuation Report for This Property
The Home Valuation Report is an in-depth analysis detailing your home's value as well as a comparison with similar homes in the area
Home Values in the Area
Average Home Value in this Area
Purchase History
| Date | Buyer | Sale Price | Title Company |
|---|---|---|---|
| Cahoon Betsy K | -- | -- |
Source: Public Records
Mortgage History
| Date | Status | Borrower | Loan Amount |
|---|---|---|---|
| Open | Cahoon Betsy K | $290,400 |
Source: Public Records
Tax History Compared to Growth
Tax History
| Year | Tax Paid | Tax Assessment Tax Assessment Total Assessment is a certain percentage of the fair market value that is determined by local assessors to be the total taxable value of land and additions on the property. | Land | Improvement |
|---|---|---|---|---|
| 2024 | $9,497 | $904,500 | $342,200 | $562,300 |
| 2023 | $6,127 | $444,000 | $170,900 | $273,100 |
| 2022 | $5,833 | $441,900 | $170,900 | $271,000 |
| 2021 | $6,713 | $437,300 | $217,900 | $219,400 |
| 2020 | $6,573 | $437,300 | $217,900 | $219,400 |
| 2019 | $6,520 | $437,300 | $217,900 | $219,400 |
| 2018 | $5,683 | $381,900 | $210,900 | $171,000 |
| 2017 | $5,492 | $381,900 | $210,900 | $171,000 |
| 2016 | $4,459 | $286,000 | $144,700 | $141,300 |
| 2015 | $4,327 | $286,000 | $144,700 | $141,300 |
| 2014 | $4,127 | $286,000 | $144,700 | $141,300 |
| 2013 | $4,015 | $286,000 | $144,700 | $141,300 |
Source: Public Records
Map
Nearby Homes