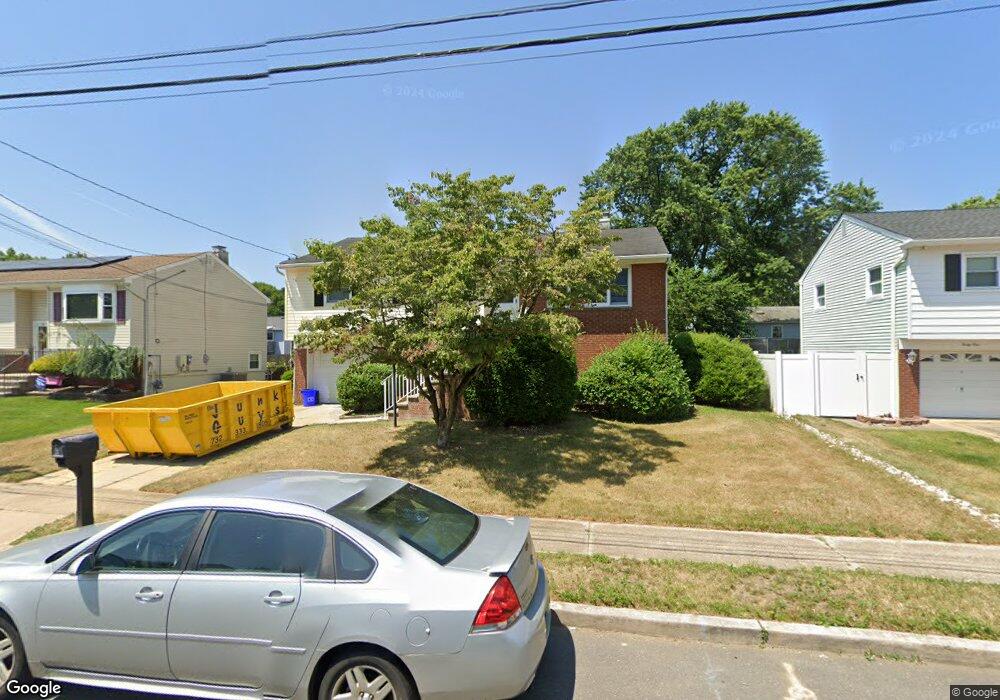
43 Shirley Blvd Old Bridge, NJ 08857
Estimated Value: $510,604 - $595,000
--
Bed
--
Bath
1,872
Sq Ft
$303/Sq Ft
Est. Value
About This Home
This home is located at 43 Shirley Blvd, Old Bridge, NJ 08857 and is currently estimated at $566,651, approximately $302 per square foot. 43 Shirley Blvd is a home located in Middlesex County with nearby schools including Old Bridge High School, St. Thomas the Apostle School, and Immaculate Conception School.
Ownership History
Date
Name
Owned For
Owner Type
Purchase Details
Closed on
Apr 28, 2022
Sold by
Sasso Paul T
Bought by
Sasso Stephen and Sasso Paul T
Current Estimated Value
Purchase Details
Closed on
Oct 1, 2021
Sold by
Sasso Stephen
Bought by
Sasso Paul T
Create a Home Valuation Report for This Property
The Home Valuation Report is an in-depth analysis detailing your home's value as well as a comparison with similar homes in the area
Home Values in the Area
Average Home Value in this Area
Purchase History
| Date | Buyer | Sale Price | Title Company |
|---|---|---|---|
| Sasso Stephen | -- | Bowes James | |
| Sasso Stephen | -- | Bowes James | |
| Sasso Paul T | -- | None Available | |
| Sasso Paul T | -- | Bowes James |
Source: Public Records
Tax History Compared to Growth
Tax History
| Year | Tax Paid | Tax Assessment Tax Assessment Total Assessment is a certain percentage of the fair market value that is determined by local assessors to be the total taxable value of land and additions on the property. | Land | Improvement |
|---|---|---|---|---|
| 2025 | $7,578 | $134,200 | $45,000 | $89,200 |
| 2024 | $7,270 | $134,200 | $45,000 | $89,200 |
| 2023 | $7,270 | $134,200 | $45,000 | $89,200 |
| 2022 | $7,103 | $134,200 | $45,000 | $89,200 |
| 2021 | $6,456 | $134,200 | $45,000 | $89,200 |
| 2020 | $6,894 | $134,200 | $45,000 | $89,200 |
| 2019 | $6,777 | $134,200 | $45,000 | $89,200 |
| 2018 | $6,702 | $134,200 | $45,000 | $89,200 |
| 2017 | $6,485 | $134,200 | $45,000 | $89,200 |
| 2016 | $6,350 | $134,200 | $45,000 | $89,200 |
| 2015 | $6,240 | $134,200 | $45,000 | $89,200 |
| 2014 | $6,177 | $134,200 | $45,000 | $89,200 |
Source: Public Records
Map
Nearby Homes
- 44 Shirley Blvd
- 37 Shirley Blvd
- 14 Brookside Ave
- 35 Birch St
- 5 Elaine Ct
- 1210 Englishtown Rd
- 306 Austin Ave
- 98 Madison Ave
- 65 Bentley Ave
- 17 Birch St
- 296 Herbert Ave
- 269 Park Ave
- 24 Kensington Ave
- 1122 Marlboro Rd
- 326 Marlboro Rd
- 19 Huxley Dr
- 21 Fourth St
- 12 Brookside Rd
- 76 Appleby Ave
- 102 Fernhead Ave