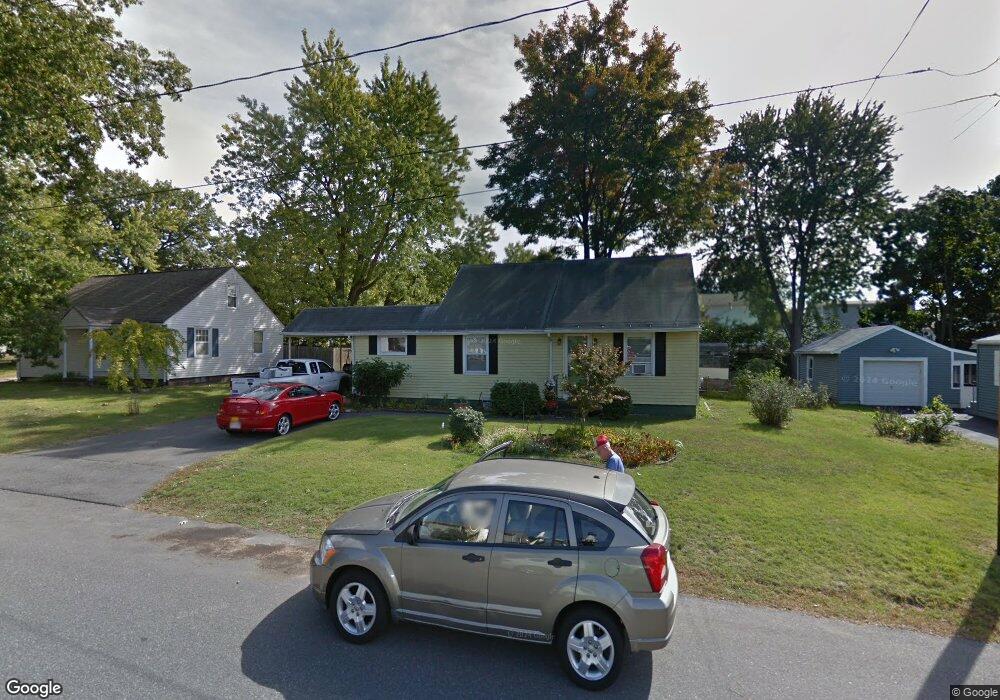
43 Shirley St Chicopee, MA 01020
Westover NeighborhoodEstimated Value: $289,000 - $348,000
2
Beds
1
Bath
1,224
Sq Ft
$260/Sq Ft
Est. Value
About This Home
This home is located at 43 Shirley St, Chicopee, MA 01020 and is currently estimated at $318,235, approximately $259 per square foot. 43 Shirley St is a home located in Hampden County with nearby schools including Bowie Elementary School, Fairview Middle School, and Chicopee Comprehensive High School.
Ownership History
Date
Name
Owned For
Owner Type
Purchase Details
Closed on
Jan 5, 2010
Sold by
Balthazar Carole and Baxendale-Lamy Barbara
Bought by
Baxendale-Lamy Barbara
Current Estimated Value
Home Financials for this Owner
Home Financials are based on the most recent Mortgage that was taken out on this home.
Original Mortgage
$104,000
Outstanding Balance
$67,935
Interest Rate
4.85%
Mortgage Type
Purchase Money Mortgage
Estimated Equity
$250,300
Create a Home Valuation Report for This Property
The Home Valuation Report is an in-depth analysis detailing your home's value as well as a comparison with similar homes in the area
Home Values in the Area
Average Home Value in this Area
Purchase History
| Date | Buyer | Sale Price | Title Company |
|---|---|---|---|
| Baxendale-Lamy Barbara | -- | -- |
Source: Public Records
Mortgage History
| Date | Status | Borrower | Loan Amount |
|---|---|---|---|
| Open | Baxendale-Lamy Barbara | $104,000 |
Source: Public Records
Tax History Compared to Growth
Tax History
| Year | Tax Paid | Tax Assessment Tax Assessment Total Assessment is a certain percentage of the fair market value that is determined by local assessors to be the total taxable value of land and additions on the property. | Land | Improvement |
|---|---|---|---|---|
| 2025 | $3,781 | $249,400 | $105,400 | $144,000 |
| 2024 | $3,587 | $243,000 | $103,300 | $139,700 |
| 2023 | $3,421 | $225,800 | $93,900 | $131,900 |
| 2022 | $3,344 | $196,800 | $81,700 | $115,100 |
| 2021 | $3,159 | $179,400 | $74,300 | $105,100 |
| 2020 | $3,050 | $174,700 | $76,300 | $98,400 |
| 2019 | $3,017 | $168,000 | $76,300 | $91,700 |
| 2018 | $2,915 | $159,200 | $72,600 | $86,600 |
| 2017 | $2,532 | $146,300 | $67,600 | $78,700 |
| 2016 | $2,523 | $149,200 | $67,600 | $81,600 |
| 2015 | $2,596 | $148,000 | $67,600 | $80,400 |
| 2014 | $1,298 | $148,000 | $67,600 | $80,400 |
Source: Public Records
Map
Nearby Homes
- 124 Deslauriers St
- 54 Sunrise Ln
- 39 Fernwood St
- 34 Deslauriers St
- 111 Festival Cir
- 39 Pinecrest Dr
- 585 Sheridan St Unit 12
- 230 Greenwood Terrace Unit 230
- 46 Honeysuckle Dr
- 66 Applewood Dr Unit 66
- 101 Doverbrook Rd
- 40 Greenwood Terrace
- 45 Doverbrook Rd Unit 45
- 1246 Granby Rd Unit 28
- 65 Woodbridge Rd
- 26 Horseshoe Dr Unit 6149C
- 134 Woodbridge Rd Unit 134
- 87 Partridge Ln
- 1150 Granby Rd
- 81 Oakhill Cir Unit 81
- 51 Shirley St
- 35 Shirley St
- 1634 Westover Rd
- 1628 Westover Rd
- 1640 Westover Rd Unit 1
- 1640 Westover Rd
- 27 Shirley St
- 174 Deslauriers St
- 1622 Westover Rd
- 1646 Westover Rd
- 1616 Westover Rd
- 46 Shirley St
- 40 Shirley St
- 54 Shirley St
- 19 Shirley St
- 32 Shirley St
- 60 Shirley St
- 26 Shirley St
- 1612 Westover Rd
- 18 Shirley St