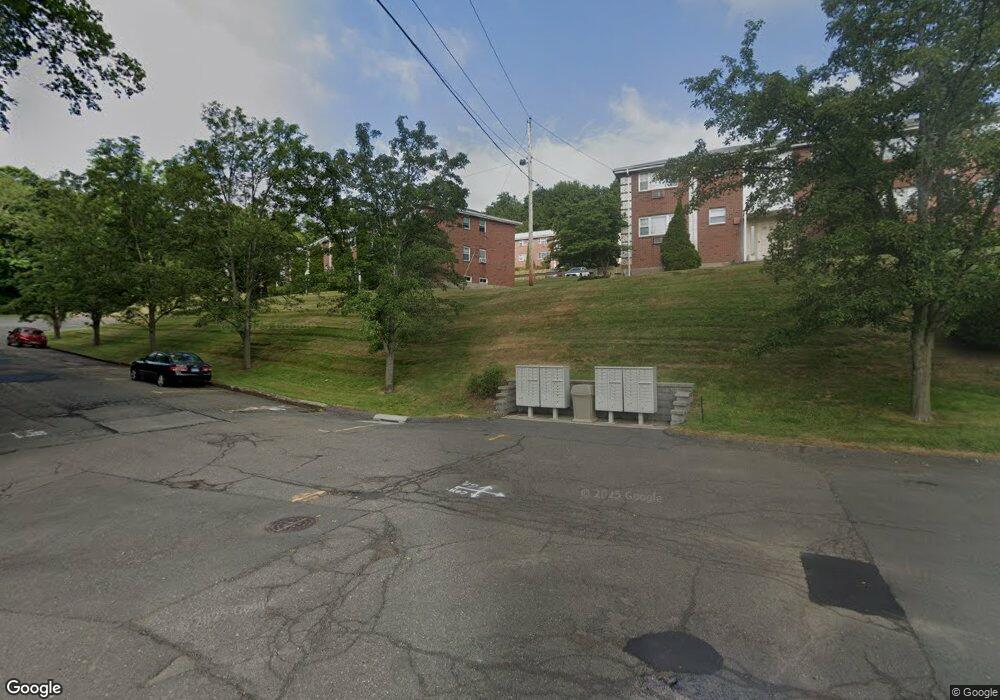
43 Sigwin Dr Wallingford, CT 06492
Estimated Value: $116,000 - $131,000
1
Bed
1
Bath
672
Sq Ft
$182/Sq Ft
Est. Value
About This Home
This home is located at 43 Sigwin Dr, Wallingford, CT 06492 and is currently estimated at $122,211, approximately $181 per square foot. 43 Sigwin Dr is a home located in New Haven County with nearby schools including Evarts C. Stevens School, Pond Hill Elementary School, and Dag Hammarskjold Middle School.
Ownership History
Date
Name
Owned For
Owner Type
Purchase Details
Closed on
Apr 25, 2012
Sold by
Mucha Kimberly J Est
Bought by
Gende Zhang Guifen and Gende Bao
Current Estimated Value
Purchase Details
Closed on
Sep 23, 2004
Sold by
Kelly Kristopher J
Bought by
Mucha Kimberly J
Home Financials for this Owner
Home Financials are based on the most recent Mortgage that was taken out on this home.
Original Mortgage
$63,000
Interest Rate
5.89%
Purchase Details
Closed on
Mar 26, 1991
Sold by
Sun William H
Bought by
Kelly Kristopher J
Home Financials for this Owner
Home Financials are based on the most recent Mortgage that was taken out on this home.
Original Mortgage
$34,500
Interest Rate
9.27%
Mortgage Type
Unknown
Purchase Details
Closed on
Jul 1, 1988
Sold by
Lenhart August J
Bought by
Sun William H
Home Financials for this Owner
Home Financials are based on the most recent Mortgage that was taken out on this home.
Original Mortgage
$68,800
Interest Rate
10.47%
Create a Home Valuation Report for This Property
The Home Valuation Report is an in-depth analysis detailing your home's value as well as a comparison with similar homes in the area
Home Values in the Area
Average Home Value in this Area
Purchase History
| Date | Buyer | Sale Price | Title Company |
|---|---|---|---|
| Gende Zhang Guifen | $40,500 | -- | |
| Mucha Kimberly J | $64,500 | -- | |
| Kelly Kristopher J | $46,000 | -- | |
| Sun William H | $76,500 | -- |
Source: Public Records
Mortgage History
| Date | Status | Borrower | Loan Amount |
|---|---|---|---|
| Previous Owner | Sun William H | $74,400 | |
| Previous Owner | Sun William H | $63,000 | |
| Previous Owner | Sun William H | $34,500 | |
| Previous Owner | Sun William H | $68,800 |
Source: Public Records
Tax History
| Year | Tax Paid | Tax Assessment Tax Assessment Total Assessment is a certain percentage of the fair market value that is determined by local assessors to be the total taxable value of land and additions on the property. | Land | Improvement |
|---|---|---|---|---|
| 2025 | $1,664 | $69,000 | $0 | $69,000 |
| 2024 | $1,193 | $38,900 | $0 | $38,900 |
| 2023 | $1,141 | $38,900 | $0 | $38,900 |
| 2022 | $1,130 | $38,900 | $0 | $38,900 |
| 2021 | $1,109 | $38,900 | $0 | $38,900 |
| 2020 | $1,413 | $48,400 | $0 | $48,400 |
| 2019 | $1,413 | $48,400 | $0 | $48,400 |
| 2018 | $1,386 | $48,400 | $0 | $48,400 |
| 2017 | $1,382 | $48,400 | $0 | $48,400 |
| 2016 | $1,350 | $48,400 | $0 | $48,400 |
| 2015 | $1,415 | $51,500 | $0 | $51,500 |
| 2014 | $1,385 | $51,500 | $0 | $51,500 |
Source: Public Records
Map
Nearby Homes
- 93 Sigwin Dr
- 303 S Elm St Unit 303
- 319 S Main St
- 27 Londonderry Dr
- 69 Terrace Gardens
- 57 Terrace Gardens Unit 57
- 65 Tremper Dr
- 357 Long Hill Rd
- 120 S Cherry St
- 137 Judd Square Unit 137
- 42 S Cherry St Unit 238
- 229 Woodhouse Ave
- 54 Claremont Ave
- 85 N Colony St
- 21 Putter Dr Unit 303S
- 70 Putter Dr Unit 211
- 16 Putter Dr Unit 207S
- 134 E Main St
- 46 Walnut Ln
- 31 S Turnpike Rd Unit C2
- 43 Sigwin Dr Unit 43
- 41 Sigwin Dr
- 41 Sigwin Dr Unit 41
- 47 Sigwin Dr
- 47 Sigwin Dr Unit 47
- 45 Sigwin Dr
- 45 Sigwin Dr Unit 45
- 49 Sigwin Dr
- 49 Sigwin Dr Unit 49
- 51 Sigwin Dr
- 51 Sigwin Dr Unit 51
- 39 Sigwin Dr
- 39 Sigwin Dr Unit 39
- 37 Sigwin Dr
- 37 Sigwin Dr Unit 37
- 55 Sigwin Dr
- 53 Sigwin Dr
- 53 Sigwin Dr Unit 53
- 303 Sigwin Unit 303
- 35 Sigwin Dr
Your Personal Tour Guide
Ask me questions while you tour the home.