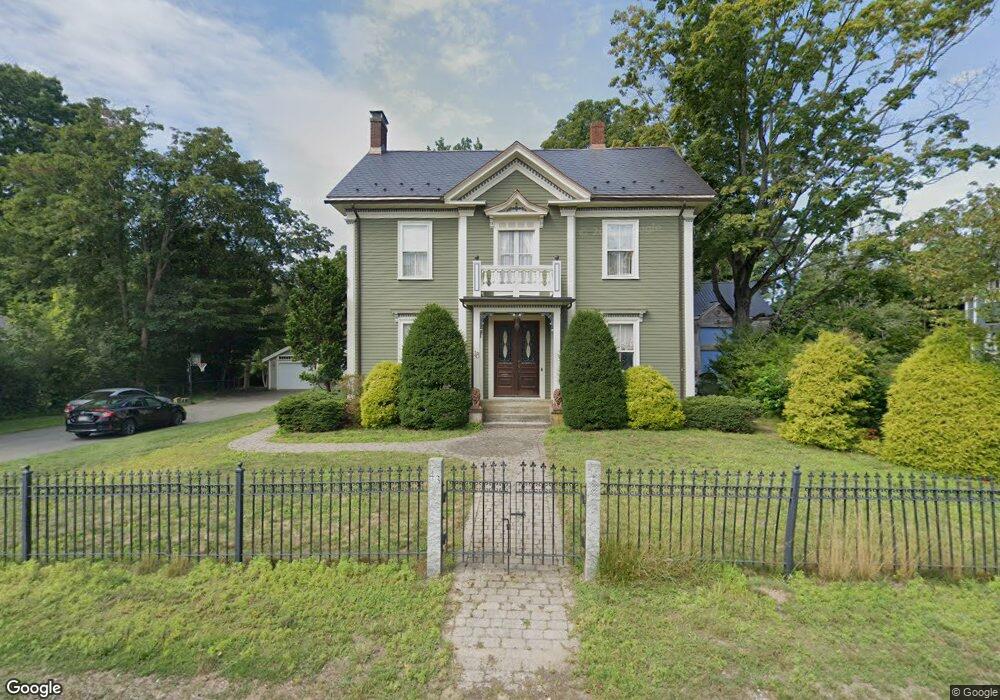
43 Summer St Weymouth, MA 02188
Weymouth Landing NeighborhoodEstimated Value: $865,943 - $1,377,000
5
Beds
2
Baths
2,616
Sq Ft
$404/Sq Ft
Est. Value
About This Home
This home is located at 43 Summer St, Weymouth, MA 02188 and is currently estimated at $1,056,736, approximately $403 per square foot. 43 Summer St is a home located in Norfolk County with nearby schools including Frederick C Murphy, Abigail Adams Middle School, and Weymouth Middle School Chapman.
Ownership History
Date
Name
Owned For
Owner Type
Purchase Details
Closed on
Nov 17, 2010
Sold by
Campanaro Edward S and Mirto Ralph M
Bought by
Ellis Kevin K and Ellis Susan E
Current Estimated Value
Home Financials for this Owner
Home Financials are based on the most recent Mortgage that was taken out on this home.
Original Mortgage
$415,000
Outstanding Balance
$272,083
Interest Rate
4.3%
Mortgage Type
Purchase Money Mortgage
Estimated Equity
$784,653
Purchase Details
Closed on
Dec 15, 2004
Sold by
Campanaro Edward S and Mirto Ralph M
Bought by
Campanaro Edward S and Mirto Ralph M
Purchase Details
Closed on
Feb 10, 2003
Sold by
Gatie Lois A
Bought by
Campanaro Edward S and Mirto Ralph M
Home Financials for this Owner
Home Financials are based on the most recent Mortgage that was taken out on this home.
Original Mortgage
$301,250
Interest Rate
5.99%
Mortgage Type
Purchase Money Mortgage
Create a Home Valuation Report for This Property
The Home Valuation Report is an in-depth analysis detailing your home's value as well as a comparison with similar homes in the area
Home Values in the Area
Average Home Value in this Area
Purchase History
| Date | Buyer | Sale Price | Title Company |
|---|---|---|---|
| Ellis Kevin K | $555,000 | -- | |
| Campanaro Edward S | -- | -- | |
| Campanaro Edward S | $475,000 | -- |
Source: Public Records
Mortgage History
| Date | Status | Borrower | Loan Amount |
|---|---|---|---|
| Open | Ellis Kevin K | $415,000 | |
| Previous Owner | Campanaro Edward S | $301,250 |
Source: Public Records
Tax History
| Year | Tax Paid | Tax Assessment Tax Assessment Total Assessment is a certain percentage of the fair market value that is determined by local assessors to be the total taxable value of land and additions on the property. | Land | Improvement |
|---|---|---|---|---|
| 2025 | $8,673 | $858,700 | $231,000 | $627,700 |
| 2024 | $8,421 | $820,000 | $220,000 | $600,000 |
| 2023 | $8,175 | $782,300 | $203,700 | $578,600 |
| 2022 | $7,939 | $692,800 | $188,600 | $504,200 |
| 2021 | $7,470 | $636,300 | $188,600 | $447,700 |
| 2020 | $7,216 | $605,400 | $188,600 | $416,800 |
| 2019 | $7,055 | $582,100 | $181,400 | $400,700 |
| 2018 | $6,841 | $547,300 | $172,800 | $374,500 |
| 2017 | $6,534 | $510,100 | $164,600 | $345,500 |
| 2016 | $6,445 | $503,500 | $158,300 | $345,200 |
| 2015 | $6,147 | $476,500 | $158,300 | $318,200 |
| 2014 | $5,925 | $445,500 | $147,300 | $298,200 |
Source: Public Records
Map
Nearby Homes
- 15 Summer St
- 107 Summer St
- 33 Congress St
- 11 Richmond St
- 122 Washington St Unit Twenty-two
- 25 Richmond St
- 19 Vine St Unit 3
- 19 Vine St Unit 2
- 82 Lester Ln
- 37 Lantern Ln
- 41 Lantern Ln
- 46 Roosevelt Rd
- 300 Commercial St Unit 23
- 31 Doris Rd
- 54 Edgemont Rd
- 211 Roosevelt Rd
- 16 Beechwood Rd
- 26 Tingley Rd
- 116 Greenvale Ave
- 312 Shaw St
- 51 Summer St
- 51 Summer St Unit 3
- 51 Summer St Unit 2
- 22 Garfield Ave
- 59 Summer St
- 32 Garfield Ave
- 35 Summer St
- 35 Summer St Unit 4
- 35 Summer St Unit 3
- 35 Summer St Unit 1
- 6 Off Summer St Unit SUMMER
- 6 Off Summer St Unit 2
- 65 Summer St
- 48 Summer St
- 44 Summer St
- 54 Summer St
- 11 Garfield Ave
- 27 Summer St
- 34 Summer St
- 34 Summer St Unit 34
Your Personal Tour Guide
Ask me questions while you tour the home.