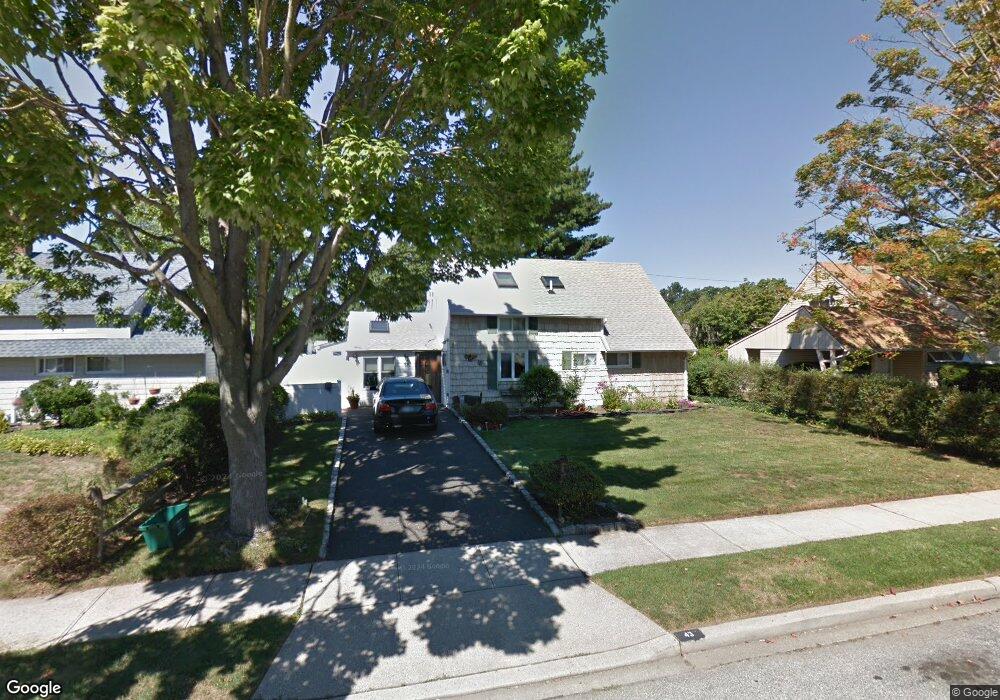
43 Swing Ln Levittown, NY 11756
Estimated Value: $677,183 - $734,000
--
Bed
1
Bath
1,562
Sq Ft
$452/Sq Ft
Est. Value
About This Home
This home is located at 43 Swing Ln, Levittown, NY 11756 and is currently estimated at $705,592, approximately $451 per square foot. 43 Swing Ln is a home located in Nassau County with nearby schools including Gardiners Avenue School, Jonas E. Salk Middle School, and Gen. Douglas MacArthur Senior High School.
Ownership History
Date
Name
Owned For
Owner Type
Purchase Details
Closed on
Feb 15, 2019
Sold by
Wittschen George and Wittschen Bernadette
Bought by
Wittschen Erin and Velez Hidalgo Vicente D
Current Estimated Value
Home Financials for this Owner
Home Financials are based on the most recent Mortgage that was taken out on this home.
Original Mortgage
$416,000
Outstanding Balance
$364,993
Interest Rate
4.4%
Mortgage Type
New Conventional
Estimated Equity
$340,599
Purchase Details
Closed on
Jun 18, 2003
Sold by
Bischoff Richard
Bought by
Wittschen George
Purchase Details
Closed on
Aug 9, 1995
Sold by
Taylor Edward and Taylor Joan
Bought by
Bischoff Richard and Bischoff Dorothy
Home Financials for this Owner
Home Financials are based on the most recent Mortgage that was taken out on this home.
Original Mortgage
$52,500
Interest Rate
7.48%
Create a Home Valuation Report for This Property
The Home Valuation Report is an in-depth analysis detailing your home's value as well as a comparison with similar homes in the area
Home Values in the Area
Average Home Value in this Area
Purchase History
| Date | Buyer | Sale Price | Title Company |
|---|---|---|---|
| Wittschen Erin | $520,000 | First American Title | |
| Wittschen George | $311,000 | -- | |
| Bischoff Richard | $152,500 | -- |
Source: Public Records
Mortgage History
| Date | Status | Borrower | Loan Amount |
|---|---|---|---|
| Open | Wittschen Erin | $416,000 | |
| Previous Owner | Bischoff Richard | $52,500 |
Source: Public Records
Tax History Compared to Growth
Tax History
| Year | Tax Paid | Tax Assessment Tax Assessment Total Assessment is a certain percentage of the fair market value that is determined by local assessors to be the total taxable value of land and additions on the property. | Land | Improvement |
|---|---|---|---|---|
| 2025 | $13,473 | $418 | $209 | $209 |
| 2024 | $3,457 | $431 | $216 | $215 |
| 2023 | $13,852 | $430 | $215 | $215 |
| 2022 | $13,852 | $441 | $221 | $220 |
| 2021 | $20,233 | $419 | $210 | $209 |
| 2020 | $15,151 | $746 | $552 | $194 |
| 2019 | $15,522 | $746 | $552 | $194 |
| 2018 | $13,194 | $746 | $0 | $0 |
| 2017 | $8,201 | $746 | $552 | $194 |
| 2016 | $11,810 | $746 | $552 | $194 |
| 2015 | $3,303 | $746 | $552 | $194 |
| 2014 | $3,303 | $746 | $552 | $194 |
| 2013 | $3,028 | $746 | $552 | $194 |
Source: Public Records
Map
Nearby Homes