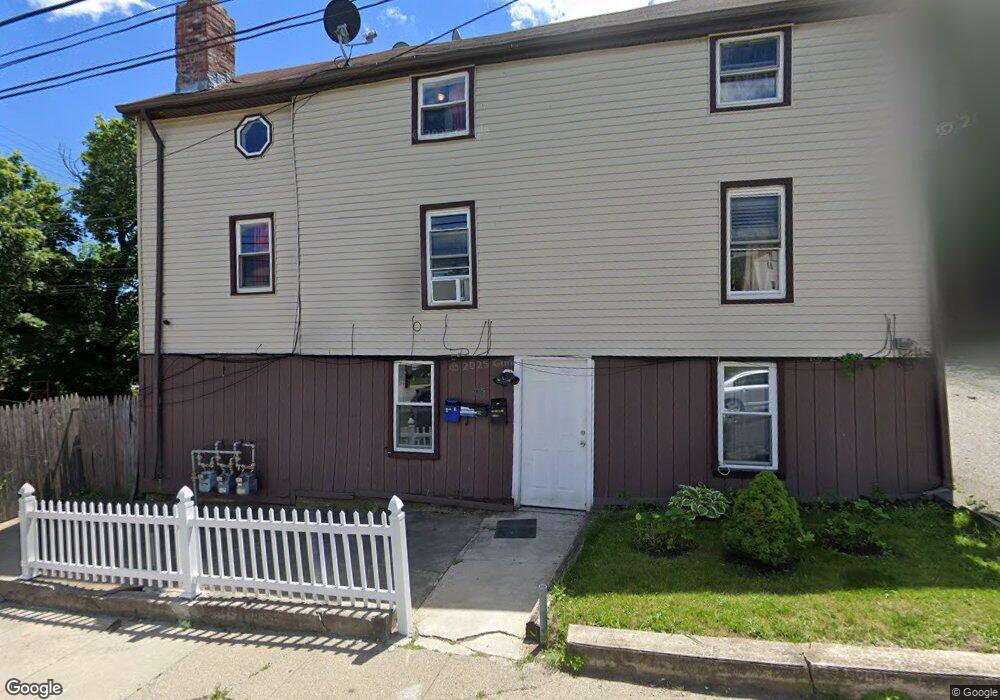
43 Tower St Pawtucket, RI 02860
Oak Hill NeighborhoodEstimated Value: $532,721 - $619,000
8
Beds
3
Baths
2,178
Sq Ft
$262/Sq Ft
Est. Value
About This Home
This home is located at 43 Tower St, Pawtucket, RI 02860 and is currently estimated at $569,680, approximately $261 per square foot. 43 Tower St is a home located in Providence County with nearby schools including International Charter School, Blackstone Academy Charter School, and Saint Raphael Academy.
Ownership History
Date
Name
Owned For
Owner Type
Purchase Details
Closed on
Jun 24, 2024
Sold by
Pawtucket City Of
Bought by
Giarusso Steven C
Current Estimated Value
Purchase Details
Closed on
May 2, 2018
Sold by
Borges Idlanda
Bought by
Dagraca-Leitao Yara J and Dagraca Ana P
Home Financials for this Owner
Home Financials are based on the most recent Mortgage that was taken out on this home.
Original Mortgage
$250,381
Interest Rate
5.62%
Mortgage Type
FHA
Purchase Details
Closed on
Apr 29, 2010
Sold by
Pearlman Thomas and Pearlman Akiva
Bought by
Borges Idlanda
Purchase Details
Closed on
Dec 1, 2009
Sold by
Gonzales Angelina
Bought by
Pearlman Akiva and Pearlman Thomas
Purchase Details
Closed on
Nov 16, 2001
Sold by
Premier Prop Inc
Bought by
Bonelli George S
Purchase Details
Closed on
Aug 2, 2001
Sold by
Griffin William J and Miele Frank S
Bought by
Premier Prop Inc
Create a Home Valuation Report for This Property
The Home Valuation Report is an in-depth analysis detailing your home's value as well as a comparison with similar homes in the area
Home Values in the Area
Average Home Value in this Area
Purchase History
| Date | Buyer | Sale Price | Title Company |
|---|---|---|---|
| Giarusso Steven C | $5,635 | None Available | |
| Giarusso Steven C | $5,635 | None Available | |
| Dagraca-Leitao Yara J | $255,000 | -- | |
| Dagraca-Leitao Yara J | $255,000 | -- | |
| Borges Idlanda | $151,000 | -- | |
| Borges Idlanda | $151,000 | -- | |
| Pearlman Akiva | $53,000 | -- | |
| Pearlman Akiva | $53,000 | -- | |
| Bonelli George S | $124,000 | -- | |
| Bonelli George S | $124,000 | -- | |
| Premier Prop Inc | $83,500 | -- | |
| Griffin William J | $645,000 | -- | |
| Premier Prop Inc | $83,500 | -- |
Source: Public Records
Mortgage History
| Date | Status | Borrower | Loan Amount |
|---|---|---|---|
| Previous Owner | Dagraca-Leitao Yara J | $250,381 | |
| Previous Owner | Premier Prop Inc | $147,955 |
Source: Public Records
Tax History Compared to Growth
Tax History
| Year | Tax Paid | Tax Assessment Tax Assessment Total Assessment is a certain percentage of the fair market value that is determined by local assessors to be the total taxable value of land and additions on the property. | Land | Improvement |
|---|---|---|---|---|
| 2025 | $5,774 | $439,100 | $113,100 | $326,000 |
| 2024 | $5,418 | $439,100 | $113,100 | $326,000 |
| 2023 | $4,841 | $285,800 | $75,400 | $210,400 |
| 2022 | $4,739 | $285,800 | $75,400 | $210,400 |
| 2021 | $4,739 | $285,800 | $75,400 | $210,400 |
| 2020 | $4,084 | $195,500 | $62,800 | $132,700 |
| 2019 | $4,084 | $195,500 | $62,800 | $132,700 |
| 2018 | $3,935 | $195,500 | $62,800 | $132,700 |
| 2017 | $3,937 | $173,300 | $64,700 | $108,600 |
| 2016 | $3,794 | $173,300 | $64,700 | $108,600 |
| 2015 | $3,794 | $173,300 | $64,700 | $108,600 |
| 2014 | $3,434 | $148,900 | $74,000 | $74,900 |
Source: Public Records
Map
Nearby Homes